
Tl;dr: This is a viral growth for startups overview which explains how to model virality in detail. There is a free excel model to download
There are 3 parts in this series:
How to model viral growth at your startup
Viral cycle time matters if you want to go viral
Basic Overview of K Factor in Viral Growth Models for your Startup
I had more planned, but the topic doesn’t seem to be that popular, so I’m not doing more.
You’ve heard about going viral. Do you know how the hell to model it in Excel? As in actually set out all the assumptions, explain how you are going to engineer virality over time across all the key drivers? I didn’t think so.
If you are a bit of a nerd, you may have read the seminal blogs by Skok and Chen who brought generalised knowledge about virality into the startup mainstream. I can remember reading about virality, jumping the shark and viral cycle times around 7 years ago. As usual, everything is treated at a very high, purposefully simplified manner. There’s somehow this expectation that you know better and will be able to figure out how to make these simple things…. pragmatic. This is of course BS, you wouldn’t be reading the simple blog intro if you knew how to do it.
I got an itch to really think about it and to really dig into the math and drivers. It’s taken me so long I’ve actually forgotten some cool insights I derived! Explaining this in the detail I wanted in blogs has put me off from finally getting it to you, so I’m shipping it! If you enjoy it and ask, I’ll write some more detailed blogs on each facet.
Please note that this is an extract from a fundraising model I made for a client. I simplified one of the sheets. The full app and social model separately forecasts users on the Android and App store…

You can download here:
Video on YouTube
If you want to watch the video version of ”How to model viral growth at your startup?” You can watch below:
What viral stuff are we going to do today?
I’m going to walk you through my model step by step and give a general overview of all the key concepts.
The ‘literature’ is lacking so I invented some concepts whilst modelling and discovering metrics I think are useful (such as the VIF)… I needed to know if what I did was total BS! Ha. I’m going to explain the implications and use of these numbers.
I am not going to nerd out on math! Yes, there is math here, so I’m going to keep this blog as the overview so you can get your grubby fingers on the model and play with it. I want to put this in your hands in the hope we can make it better!
So let’s kick off.
Engineering virality
Virality does NOT happen. I differentiate virality from word of mouth. WoM happens, virality is a product phenomenon that is engineered by thousands of little optimisations requiring product design, a growth hacker like mentality and a keen understanding of human behaviour.
So to understand the initial part of the model, you need to understand there are 5 key drivers. These are:
- Invite calculations

- Conversation rate calculations
- Viral cycle time calculations
- Churn calculations (First month churn) – Note we deal with ongoing churn in a separate sheet
- Market size calculations
Invite and conversion
(1 and 2) Invite and conversion are the key determinants of the K factor. If you don’t know about this, read about it here.
In short, in math terms, the formula is:
K= I x R
Where:
- I = invitations (Distribution)
- R = conversion rate (Infection)
K basically says how many new users will an existing user bring you. It’s a simple concept espoused in most blogs, but I think is wrong and simplistic. It needs to be adjusted. We will come back to this.
Cycle time
Next, your viral cycle time (3) says how fast does it take for someone to invite others and for those people to convert. You can read about it here. It can be a leverage factor to make your K factor have a larger effect. It’s a bit like taking debt into your cap structure to leverage your returns. It can be great, but only if your business has the fundamentals right (ie your K is solid).
Churn
Now churn (4) is to me the most profound variable which is not discussed enough at all. It’s so important it’s not funny. Basically, nothing matters if your churn rate is crappy. Nothing. In the big blogs, the commentators will throw in ‘you aren’t thinking about churn,‘ so clearly smart people are aware, just not enough.
Churn is like a big hole in a bucket when you are carrying water to your house from the garden. The size of the bucket is your K and the time it takes to walk home is the cycle time. Bigger bucket means you ‘can’ get more water home, short distance to home means you can bring water over faster… but with a massive hole, is any water getting into the bath at all? If it’s a big bucket, maybe nothing at all! Would you rather a leaky massive bucket, or a small bucket that works?
Market size
Finally, (5) your market size matters. This may seem like a weird one to you. Why does market size matter!? Well, there is always a cap on the size of the market you can capture. Let’s pretend you are taking water from a well, but the well is almost dry. You have so many pales you can get out of it. Your goal is to fill a bathtub so you get to $100m ARR so you can IPO? Let’s say each bucket brings $5m of water, so you need 20 perfect buckets to fill the bath. Now the well only has 40 buckets since only so many people in the world will ever buy your accounting software for warehouses. There literally are a cap of warehouses in the world!
So… you startup and draw the well. You take out 1/40 of the total but you suck. You don’t have the right integrations, you have outages, you don’t have good customer success. Your bucket is leaky. By the time you get to the bath almost all the water has fallen out. You get $1k MRR.
CRAP!
You’ve blown 1/40th of your market already.
You get better but time passes and now there is only one bucket left… The bath won’t cover an anaemic ant still. You’ve just reached the cap of the well (your total market or TAM), so what now.
But let’s pretend the bucket is onboarding and you got better at fixing the bucket hole so you did get water in the bath (onboarding)… but now you discover a worse problem, you didn’t plug the hole in the bath (FML). So you have been churning out water from the bath (bad retention)! Darn. There’s nothing left.
As you can see, churn and market size are close cousins. Market size certainly matters if you have crappy churn, both in initial conversion and retention. You can max out your market, and games such as from Zynga or Draw Something proved this.
So to get back to the 5 drivers.
Everything matters to get viral
They all matter.
They all can be optimised.
You need to have a focus on all of them.
You will always assume that you start at a lowish base rate (unless you have metrics from results which show otherwise). You want each to get better over time through focused efforts. And if you can get lots of small wins… magic can happen. No shit. Real virality (in a traditional sense, a K greater than 1) is crazy AF! Play with the model and see how big numbers get and how fast! It’s pretty much indefensible in a pre-seed model, as it’s so cray cray.
So start small and show how you will get better.
- Invite calculations – you find more opportunity points to encourage users to invite more friends. CandyCrush bakes this in everywhere (Ask a friend for a life)
- Conversation rate calculations – you get better at getting new users to actually convert. It could be an incentive (Dropbox give one get one), it could be better landing pages
- Viral cycle time – reduce all friction possible to get people to sign up. This is a little tricky to define, but time to getting a wow moment and overcoming fear is clear but impossible to define the path to getting users to share and making a cycle happen (You can listen to a podcast on the importance of viral cycle time here)
- Churn calculations (First-month churn) – we deal with initial churn here not retention churn since most apps lose 65% in month one. You find ways to ensure users don’t delete your app which is fundamentally not having a crappy product and not marketing till it’s good enough
- Market size calculations – you increase the potential pool of users by extending functionality, targeting new demographics
Yes, each factor needs to be thought about, and some are mutually inclusive (meaning efforts in one area will benefit another factor).
The model sets out each driver and gives you up to 7 explicit ‘feature improvements’ you will work on which will result in a positive (or negative, if you wish!) effect on each driver. You even set the month it will happen due to a feature release or iteration.

Viral driver assumptions
We just went through a crash course on the key drivers. Are you still with me?
Let’s have a quick look at them so you can visualise them. We will start with say, ‘invite calculations.’ Each section is set out the same way.

So you can see the ‘base rate’ is 5. We assume each user will make 5 invitations to their friends in the onboarding process.
That will stay consistent until month 6 when we say we release feature 1 (yeah, I should have written some BS feature names but get over it). This new feature we think will lead to a 0.5 improvement in invites. So we will be at 5.5.
Yes, that’s total finger in the air! But it’s a good way to set goals for your product manager! haha. Better than nothing. Tell her she needs to make it better in 6 months!
So let’s pick another variable. We want our viral cycle time to DECREASE. So I say we are going to have three feature releases which will decrease the days down by half a day but inputting a negative 0.5. So our cycle time decreases to 7.5 days.
How about churn? We would like that to decrease over time! So we start with 40% churn and then we decrease it by making it easier to find friends (think 7 friends on FB). A new feature decreases churn by 3%.
Finally, bigger market size is good. We start in UK and think most of the 50m documented population will use our app. Then we expand to France the next month and may have another 25m users to promote to. Our market is now 75m… which we hopefully don’t churn through!
So each improvement, however small, if aggregated over time leads to improvements in your K factor and the other funky stuff I am about to teach you about. Understand lots of small changes really do have an impact! When you get to K=1 a tiny improvement over 1 makes the impossible happen. Yes, a tiny tiny tiny improvement then is Kim’s ass HUGE!
By mapping out a clear schedule, you can add in little changes (and remove them) and start to internalise over time the effect on your virality. I think it is powerful to be able to disaggregate the assumptions in this manner to really internalise the effect of everything you do.
Paid acquisition stokes viral growth
100% growth from 0 is 0. You need users from somewhere. Yes. Yes. You can hustle a few users, but at some point, you’re going to pay for them. Heff ended up paying for it too.
The first assumption in the model is the users you actually acquire. You input them in the yellow box. You can see the total summary of users at the top of the image.

From this, you get hopefully lots of free users. Or maybe viral lots of users!
Input the viral growth assumptions
We went through these at a high level before. Here you see a grouped up version with the high-level base rates. The ungrouped bit is where you get granular.
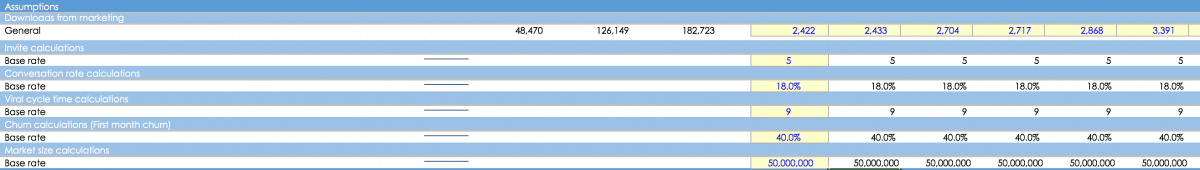
So we get:
- 2/3k paid users a month from marketing stuff
- Invitations of 5
- Conversion on invites of 18%
- It takes 9 days for a cycle time to happen
- First month churn rate is 40%
- The market size we think we are targeting is about 50m users
These are all BS numbers I picked to have non-viral growth. I’ve chucked in some optimisations to make the viral factors better over time for illustration
Viral growth math overview time
Now we are going to get into the ‘science bit.’ It was always going to happen…
Here are all the formulas in the model:
| Viral invitation factor (VIF) | VIF = Users (t + 1) = [Users (t) x (K x (1 – L))]^ [((t / ct) + 1) – 1] / [(K x (1 – L)) – 1] |
| Viral coefficient (K) | K = I x AR |
| Effective Viral Growth Factor (EVGF) | EVGF = K x (1-L) |
| Adjusted conversion rate (AR) | AR = R – (R x (CD / M)) |
Um, so what do these mean?
| Viral invitation factor (VIF) | The number of new users that come from a cohort adjusted for churn |
| Viral coefficient (K) | Simplistic calculation of the viral coefficient. Assumes the ‘% of customers that make invites’ is baked in |
| Effective Viral Growth Factor (EVGF) | Viral coefficient less churn rate, in the first iteration |
| Adjusted conversion rate (AR) | Conversion is adjusted to market size proportionally to share of market churned through, on previous month downloads (Prevents an iteration) |
And the variables for the math letter things:
| Time | t |
| Number of invites | I |
| Conversion rate | R |
| Adjusted conversion rate | ar |
| Saturation point of market | |
| Viral coefficient | K |
| Viral Cycle time | ct |
| Churn | L |
| Market size | M |
| Cumulative downloads | CD |
Adjusted Conversion Rate and Adjusted K
Let’s start with what you know. K factor. I show K = I x AR, NOT K = I x R. So I have swapped the R for AR. This is your adjusted K.
We talked about the market size mattering. What we basically do is make the conversion rate worse as you take more of the market share. So when you get to 100% market penetration your conversion rate (AR) is 100% crap, ie ZERO. You can’t get any more users when you have gone through the whole market.
At 50% market share the R of 18% is now 9%. That halves your K factor. See what is happening?
A term to describe crappier AR is the ‘saturation point of the market.’ You can see it below getting up to 4.6% in year 3.

We are adjusting your K down proportionally as you penetrate the market. If you have a huge market and low K (and acquiring less users) then you won’t register this adjustment
This formula is how you make the K crappier: AR = R – (R x (CD / M))
Just play with the model 😉
So that is the big change to how one normally thinks about virality.
Now we are going to delve into a new abuse of K to force it to make more sense. This is something I have coined since no one has.
Effective Viral Growth Factor
The EVGF is the Effective Viral Growth Factor. The math is this, EVGF = K x (1-L), but all it says is you make our adjusted K (crap, I should have termed that too to be clearer!) less by the churn rate. The 1 minus bit is the remainder, so with an initial churn of 40%, our adjusted K is just 60% of the amount.
What is this about? Well, churn is real and everyone has it like upper lip hair (god bless bleaching). It’s massively important. I refer to the initial churn as you need to know what it is for viral cycles.
Since viral is all about iterations, or cycles, you need to know how leaky the bucket is every time you walk to the bathtub. What happens when you chuck the water in the bath is different. The calculations are all about initial churn, not retention churn. The users you lose before they are real, don’t matter. They will never make intros for you to get new users. It’s only users that like you, or you engineer (by hook, crook or accident that make intros).
The EVGF is a simple but really important concept.
Now, we are almost done!!! This is the hard bit and it took me forever to figure out.
Viral invitation factor
Viral invitation factor (VIF) is sort of a meta number and it’s something I coined. It says for every defined time period, working through all the cray cray viral math, how many users do you actually get given all the assumptions?
The formula is this:
VIF = Users (t + 1) = [Users (t) x (K x (1 – L))]^ [((t / ct) + 1) – 1] / [(K x (1 – L)) – 1]

You may notice with your eagle eyes K x (1 – L). That’s the EVGF. It’s in the numerator and denominator of the VIF formula.
You will also see ‘ct’ which is short for cycle time. The CT is how fast shit happens, I mean a cycle. The ct is to the power (see: “^ [((t / ct)”) and a divisor (see: “/ ct”), so being a divisor you want it to be small, and as an exponent, that smallness means multiplication. Don’t worry, I suck at math too. But a small divisor in an exponent is good when you want big numbers, but terrible if you are calculating your mortgage repayments.

You can see the EVGF is 0.63 then 0.9 in year 3.
You can also see a series of VIFs from 30 to 1080 days (3 years). The 30 day in the first column (year one, I know there are no headings) is 2.3 in 30 days. This means each user brings 2.3 new users. The 1080 day VIF is 2.7. That delta is pretty rubbish. Clearly, your churn etc is resulting in very little effective viral adoption over time.
But remember I said I made the numbers better over time… well look at the third column. We start with a VIF of 4.1 in 30 days but over 3 years it results in 9.5! Boom. That’s clearly better. Each new user results in 9.5 over 3 years. This is NOT viral growth but clearly, the improvements I made are more than 3x better than in year one. That’s not to be sniffed at, right?
But what is going on?
Little things matter in viral growth math
We got a 3x uplift in the VIF over the three years. Why? Let’s review the numbers to understand this. Here are the assumptions and outputs:
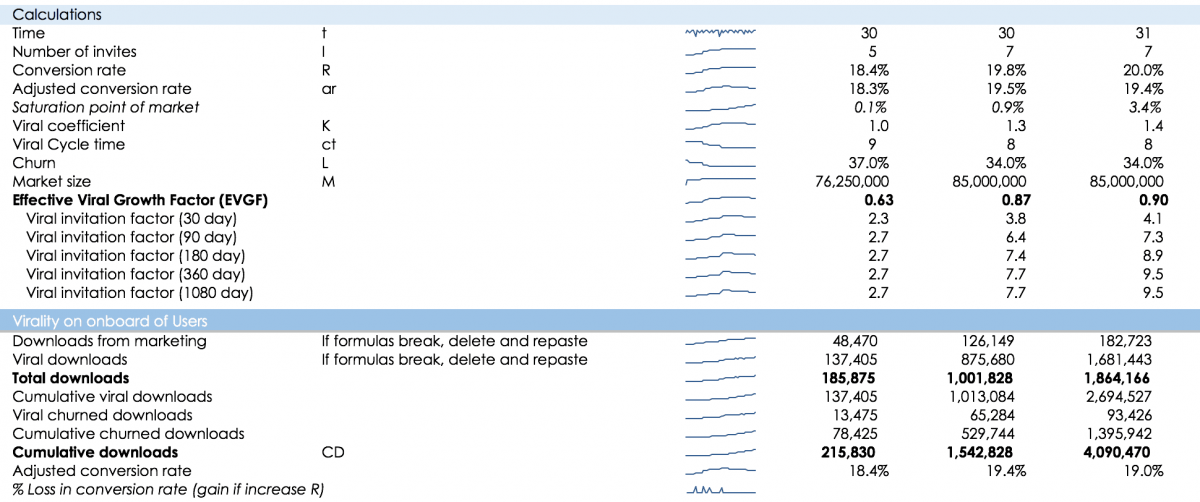
So you can see the EVGF goes from 0.63 to 0.90. This doesn’t seem too crazy a change but our 1080 VIF goes from 2.7 to 9,5. In fact, in year 2 it goes from 2.7 to 7.7. That change is profound in year 2, but look at year 3. Our EVGF increases by 0.03 in year 3 but it results in a VIF 1080 at 67% of the benefit of an EVGF of having an EFGF of 0.63 (9.5 less 7.7 is 1.8 which is 67% of 2.7). There’s an exponent at play here.
What happened to make this witchcraft? Well, our AR decreased a little (bad) but the K increased from 1.3 to 1.4 as the conversion rate optimisation compensated (good) and the cycle time decreased a tiny bit too. It’s hard to see the assumption changes but the outputs are big!
I mean look at the downloads… We got less than 200k in year one, but man, year 3 we got 10x more! This viral stuff with very small changes (but sure, a lot of work) has resulted in crazy numbers! The closer to an EVGF of 1, the crazier the results. What happens if your EVGF is greater than one is sick.
Impact of churn
I’ve tried to make this simple (no stress, it’s so not!). Now we have a tonne of calculations to do one simple thing, figure out the churn that’s happening. In the VIF calculations, you are churning out users in each cycle. If you have a 7 day cycle, then in 1080 days you have had 154 cycles. If your churn rate is 40% then you have 154 cycles where you lose 40% of users in each cycle… so those numbers are likely to get real small unless your EVGF is huge (which is not likely).
But we need to know how many users you churn out to calculate your AR (the adjusted conversion rate). I WISH this was simple to do, but it is so not. If you have a market of 50m people and you are churning out 40% of people then before normal regular churn, you only have 30m, or 60% of users you might ever really interact with. That’s not the exact number, but I’m trying to keep things simple.
As you churn through users, yes, you reduce your addressable market. All this calculates one line!

What do viral growth charts look like?
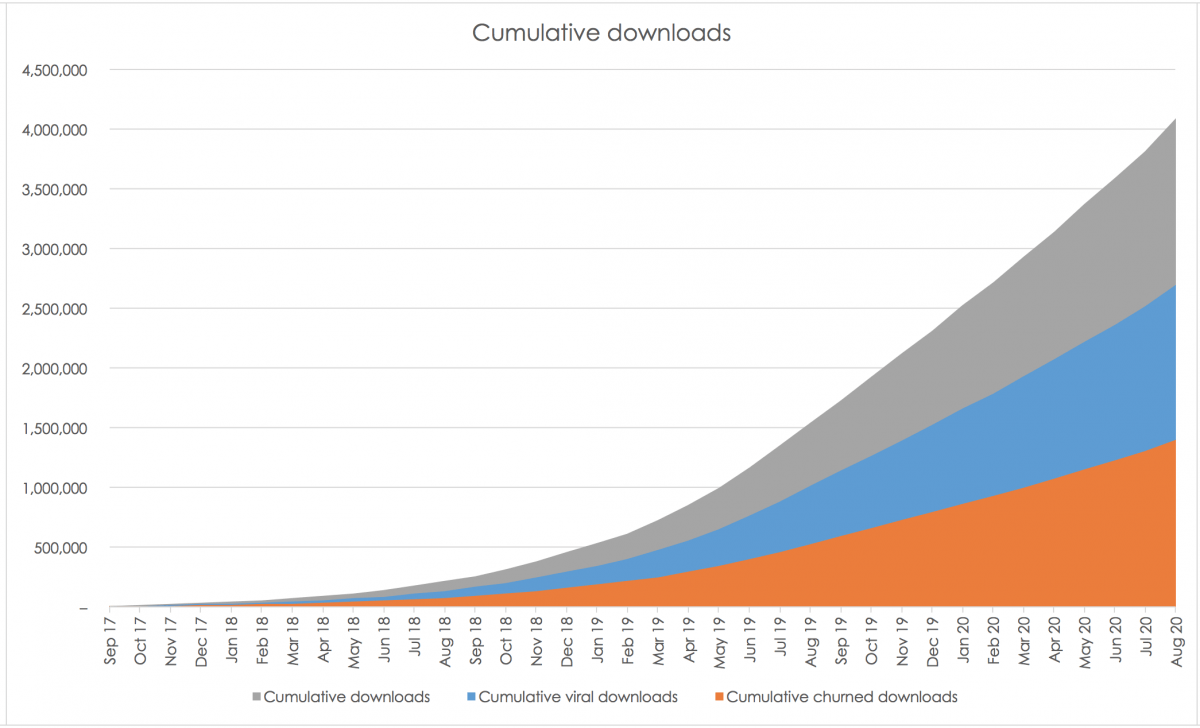
We have run through everything that contributes to growth, what do the charts look like? Here are three. Note, some are stacked so you need to pay attention.
So, firstly, you see the orange? That’s bad. It’s more than the pretty blue which is good. Orange is churn. Grey is the total downloads on your app but it’s not all good.
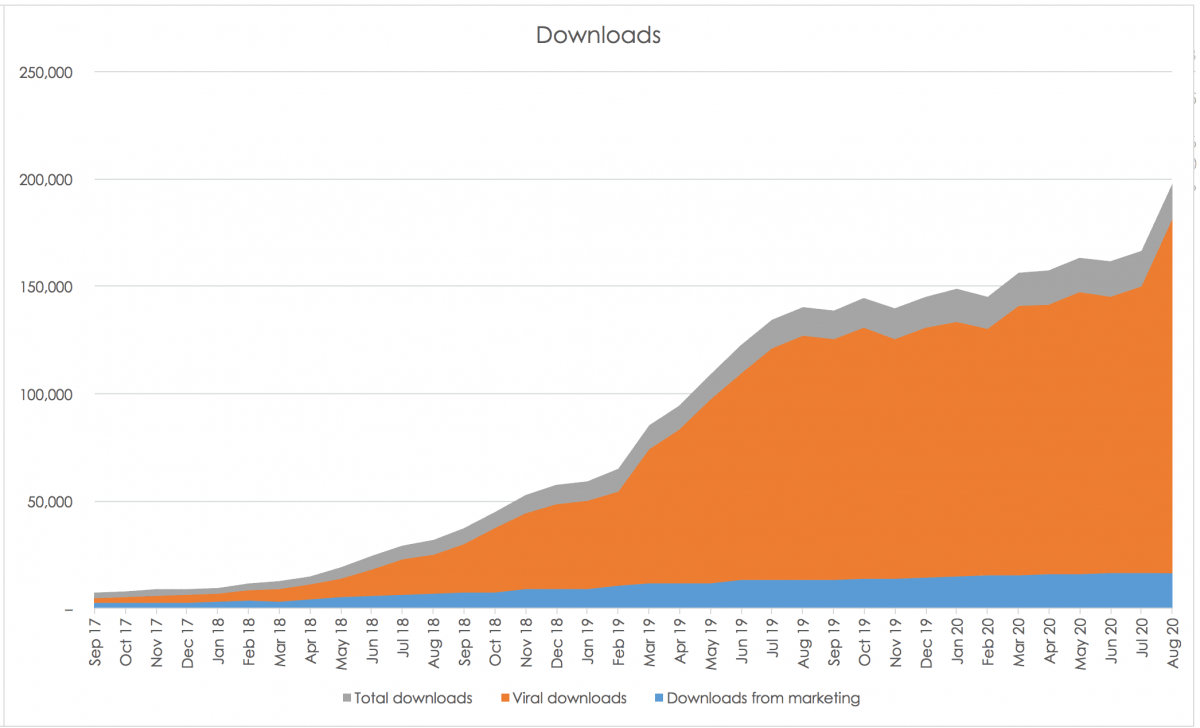
Viewed another way, you can see in blue what you get from activities to acquire users. The orange is the land of the free. That’s viral land.
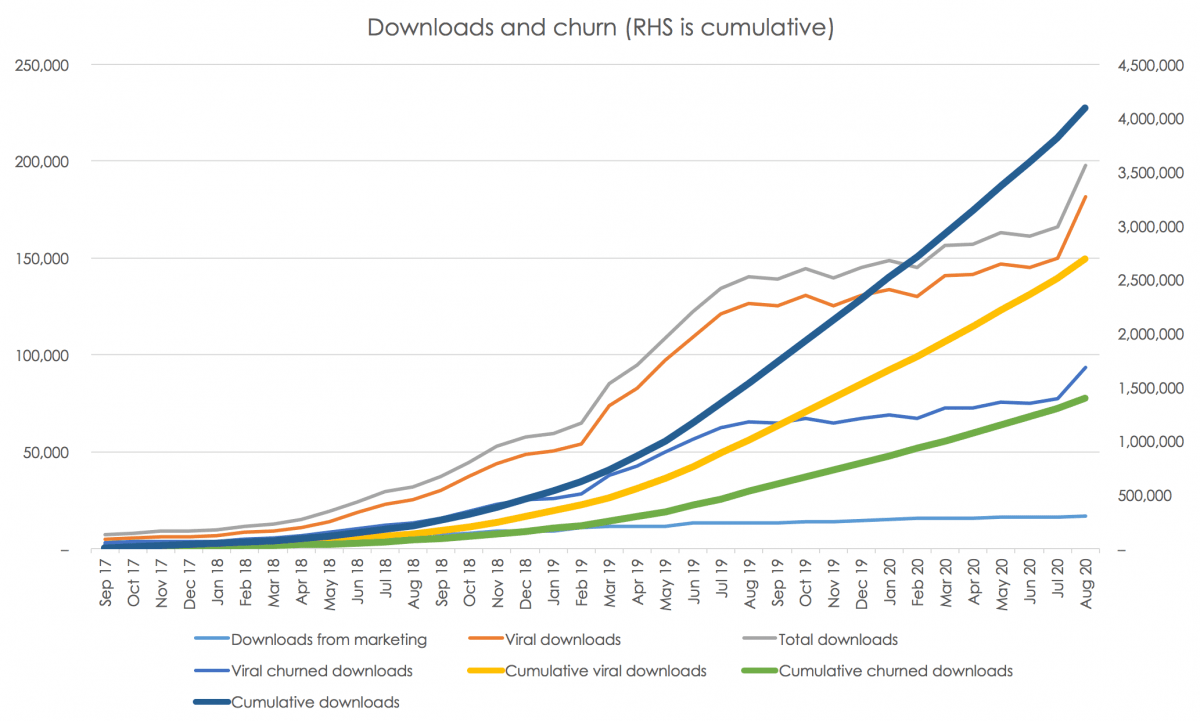
Here we see the full breakdown.
Ongoing churn
Up to now we have only talked about initial churn. In each cycle, you assume initial churn happens so that in every future cycle there are less (or more) users in each cycle depending on your EVGF.
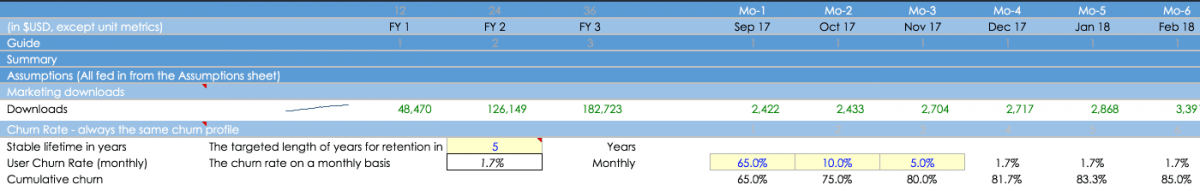
But churn will still happen each month. Most apps lose 80% of users in three months, which is insane I know. Yes, it depends on the type of app, but not by much. Here are some stats from a survey:
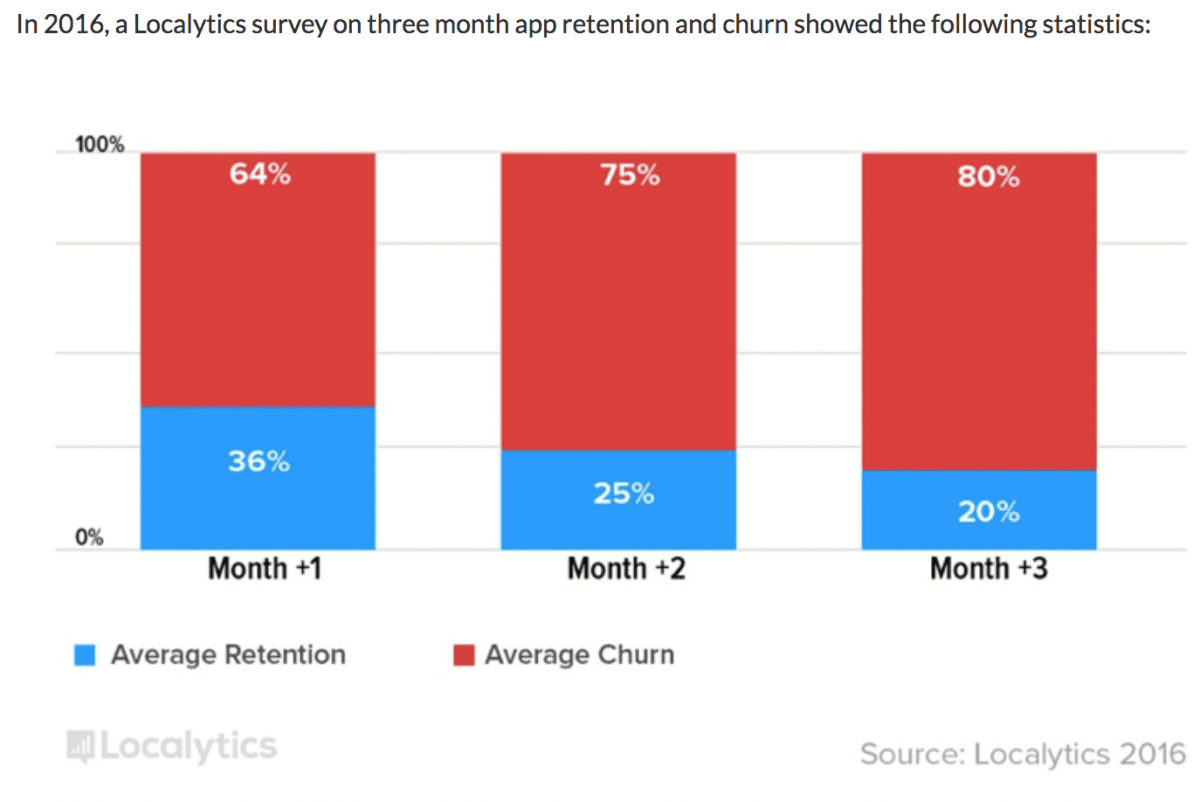
So to calculate your ongoing churn you need to make some assumptions.
- Stable lifetime: Set the number of years you retain customers post your manual assumptions. This is the long term churn rate (1.7% per month will churn)
- Then set your churn in the first three months. The first month of 65% is just for acquired users, not the viral ones since we set this in the Virality Sheet. 10% and 5% in month 2 and 3 impact all users
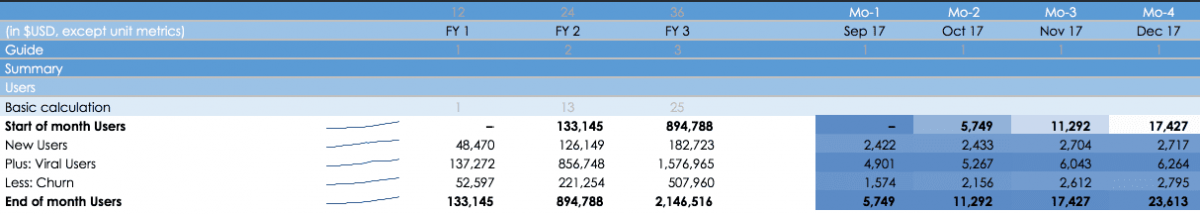
Here you can see a summary of your users from beginning or month/year and the end of the period.
It’s a sum of what you start with, plus your new paid users, your viral users and deducts the churn. The result is the end of period. We end up with 2.146m users at the end of year 3.
Here is an overview of all the individual waterfall calculations:

Here is an overview of all the waterfall calculations in their splendour!

That’s the model done!
Sensitivity tables
I wanted to see what variables and coefficients really mattered so I made a couple of big sensitivity tables. The results back up what I have been saying.
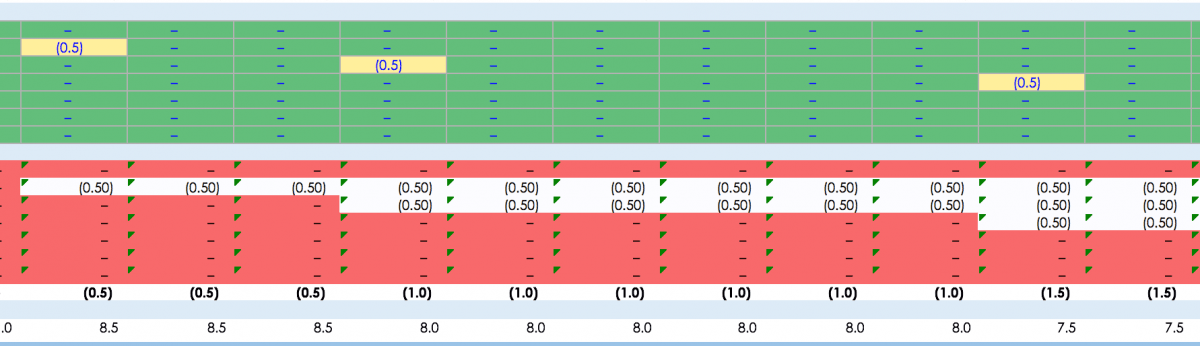
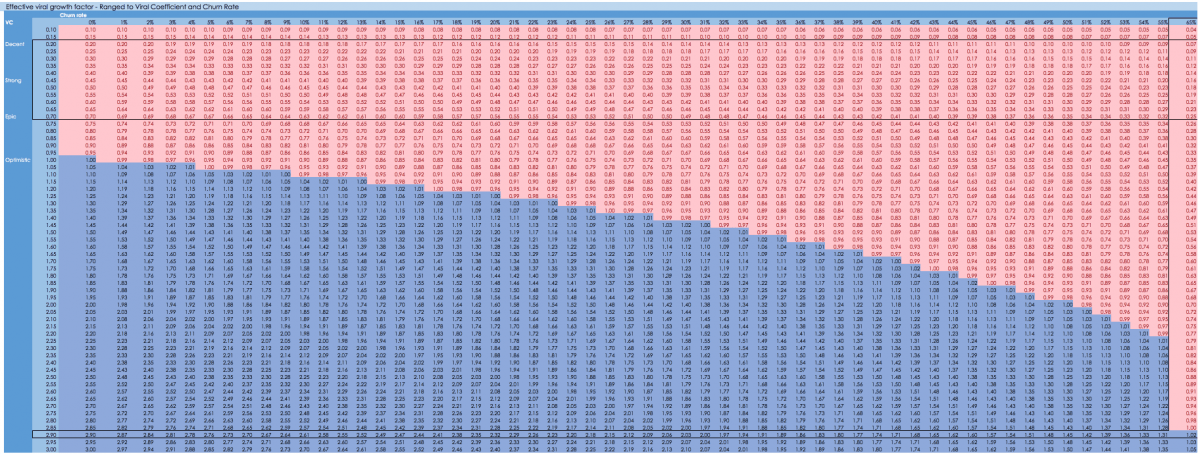
Effective viral growth factor – Ranged to Viral Coefficient and Churn Rate
Here we look at the EVGF. Bigger is better. The red conditional formatting shows each cell that is less than one, the blue is what is equal to or greater than one.
With eagle eyes, you can see the last column which has churn of 65% which is the average churn you might experience for your app. You need to have a K of 2.9 to just get viral at 1.02! That is ridiculously high. On the other hand, if you have no churn your K and EVGF are the same, so a K of 1 is an EVGF of 1 too.
Churn is a killer.
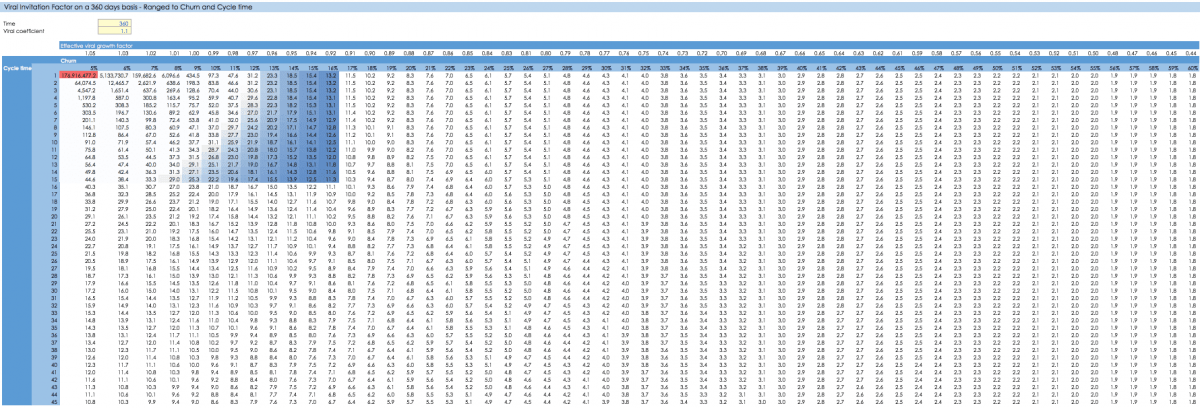
Viral Invitation Factor on a 360 days basis – Ranged to Churn and Cycle time
Finally, let’s look at the effect of your VIF as ranged to Churn and Cycle Time.
If you have churn of 5% and a cycle time of one day… your VIF is 177m! Crazy right?

Churn less than 10% is pretty special. Your numbers get huge every percentage less.
Your cycle time does not matter if your churn is high. If you have a churn of 15% then decreasing your CT from 30 days to one day gives you a VIF uplift of only 9 to 15.4.
However, at 5% churn, decreasing your CT from 30 days to one day gives you a VIF uplift of 17.2 to 177m!
CT only matters if churn is low. It is not the most important variable.
Conclusion
Congrats on getting through all of this! It took a massive effort to figure this out on my part. Get the model and have a play yourself. The only way you will truly internalise everything is by playing with variables and seeing the outputs. Once you really understand all the drivers you will be able to think critically about how you engineer virality at your startup.
Now you are unlikely to go viral, but a little bit of virality will decrease your effective CAC which is really nice. If you are a SaaS company then you are 99.999% unlikely to go viral and it will take a long time to engineer any form of virality. Echosign had a K of 0.2 and had a CT of 8 months.
As Jason Lemkin writes:
It really wasn’t until the end of Year 2 that viral really kicked in. That’s just the math of a low viral coefficient. And it didn’t even get good until Year 3, when we finally had a large enough installed customer base, using the product, to become our second largest source of new customers. Today the best SaaS companies are scaling faster, so you may see material results faster. Maybe. But you still have the physics of lower viral coefficients to overcome.
Download the model and have a play! If you have any thoughts, sound out in the comments, I’d love your feedback.

Comments 4
Great job !
Author
Thanks, Alex!
Hi Alexander,
Thanks for sharing this.
Is the model iterative. I get a lot of “circular dependency”
Author
Turn on iterative calculations. Watch https://www.youtube.com/watch?v=T1EXeFBcKUE&t=3s