| Formatting |
Input the start dates for the actuals and forecasts to start. These are key to align actual and forecast in the model output sheets and how the combined sheet combines them |
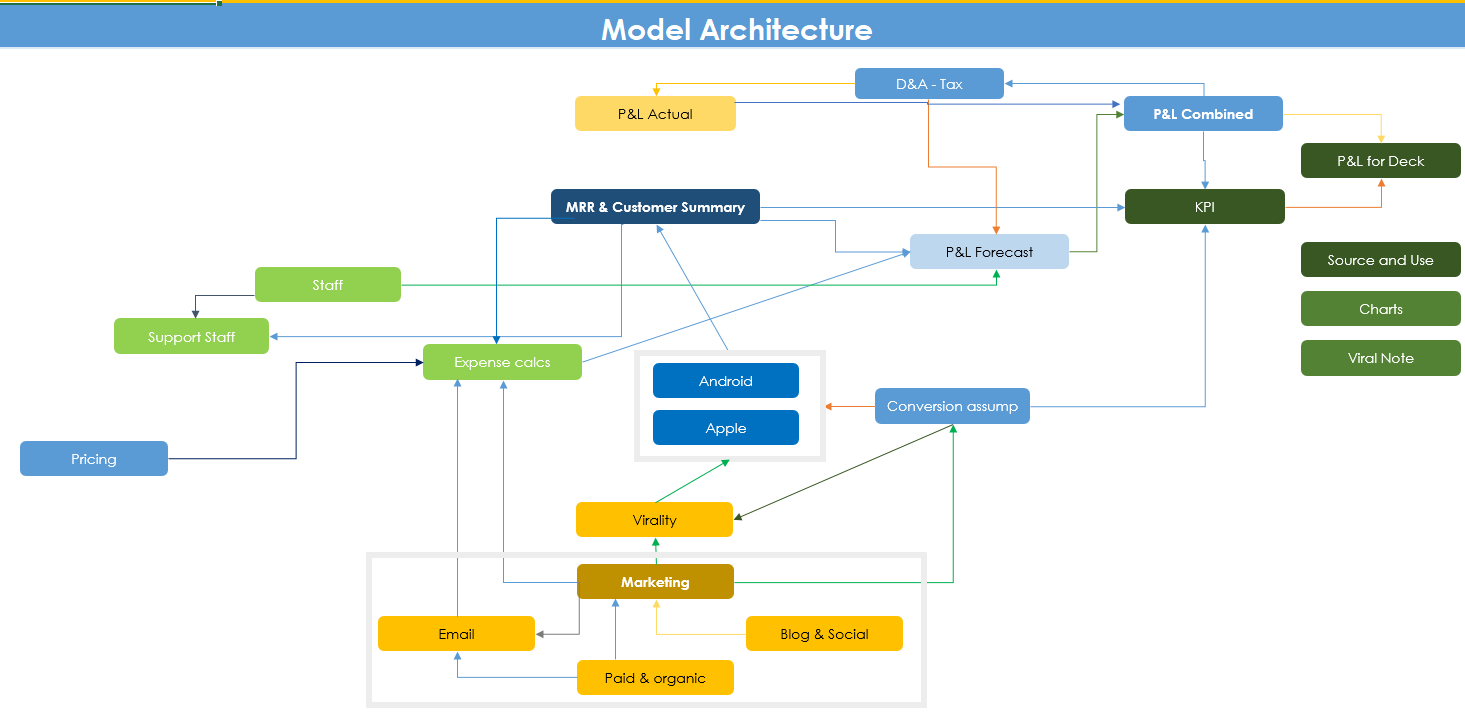
| P&L Actual |
This is the P&L of your actual numbers. Put in your actuals and they get represented in your combined P&L. These feed into revenue forecast sheets so you build your forecast off actuals |
| P&L Forecast |
Detailed forecast P&L of your startup. Output of all your assumptions. This is the sheet to focus on. There are few assumptions in this sheet |
| P&L Combined |
This combines the forecast and actual sheets together |
| Source and Use |
Use this to figure out how much to raise and to present your 'sources and use' of money you raise in your 'ask' slide |
| D&A - Tax |
Calculate your depreciation (there is no amortization) and your tax simply. You can be complicated or not as you choose |
| P&L for deck |
This combines the summary forecast and actual sheets together for the first 12 months and for 3 years annual to insert in your pitch deck. Change as you need to present your key numbers important to you! |
| KPI |
A detailed summary of all your KPIs |
| Charts |
Summary of charts from across sheets |
| Staff |
Forecasts for all staff (Other than warehouse, photography and customer care staff). All the related staff and G&A costs |
| Expense calcs |
These are your payment and tech expenses. Basically COGS |
| Support Staff |
Calculates customer support staff automatically on the basis of customer forecasts |
| Revenue |
Assumptions for service and ad based revenue pricing which feed into the Apple and Android sheet to forecast your revenue |
| MRR & Cust Summary |
A summary of your user calculations (The calculations in the Apple and Android sheets are long) |
| Conversion assump |
All the assumptions that drive how marketing converts into users, either Apple or Android users. These power the Apple and Android sheets |
| Virality |
All the assumptions and viral calculations. This is treated as separate to the other marketing sheets since virality is an engineered phenomenon and not something you throw cash at and just happens reliably |
| Viral note |
This ranges key assumptions to help you understand the impact key variables have and the point at which they are meaningful |
| Apple |
Calculates user growth, churn and revenue for Apple users in a cohort based approach |
| Android |
Calculates user growth, churn and revenue for Android users in a cohort based approach |
| Marketing |
Centralizes the marketing data and applies conversion rates to create 'downloads' of your app which you then categorise as Apple or Andoid users (Which then might buy) |
| Paid & organic |
Organic growth and paid traffic to the site. Feeds to the traffic build in 'Marketing' |
| Email |
Calculates the sign ups to your email database. Feeds to the traffic build in 'Marketing' |
| Blog & Social |
Calculates the traffic that comes from promotion activities by blogging and social media. Feeds to the traffic build in 'Marketing' |