Tl;dr: This is a quick overview of the cap table model so you understand what is in it
How the model works
The format page sets out the assumptions for drop-down menus. It also is used to explain what the assumptions mean. You shouldn’t change anything on this sheet unless you have a specific reason (but you can).
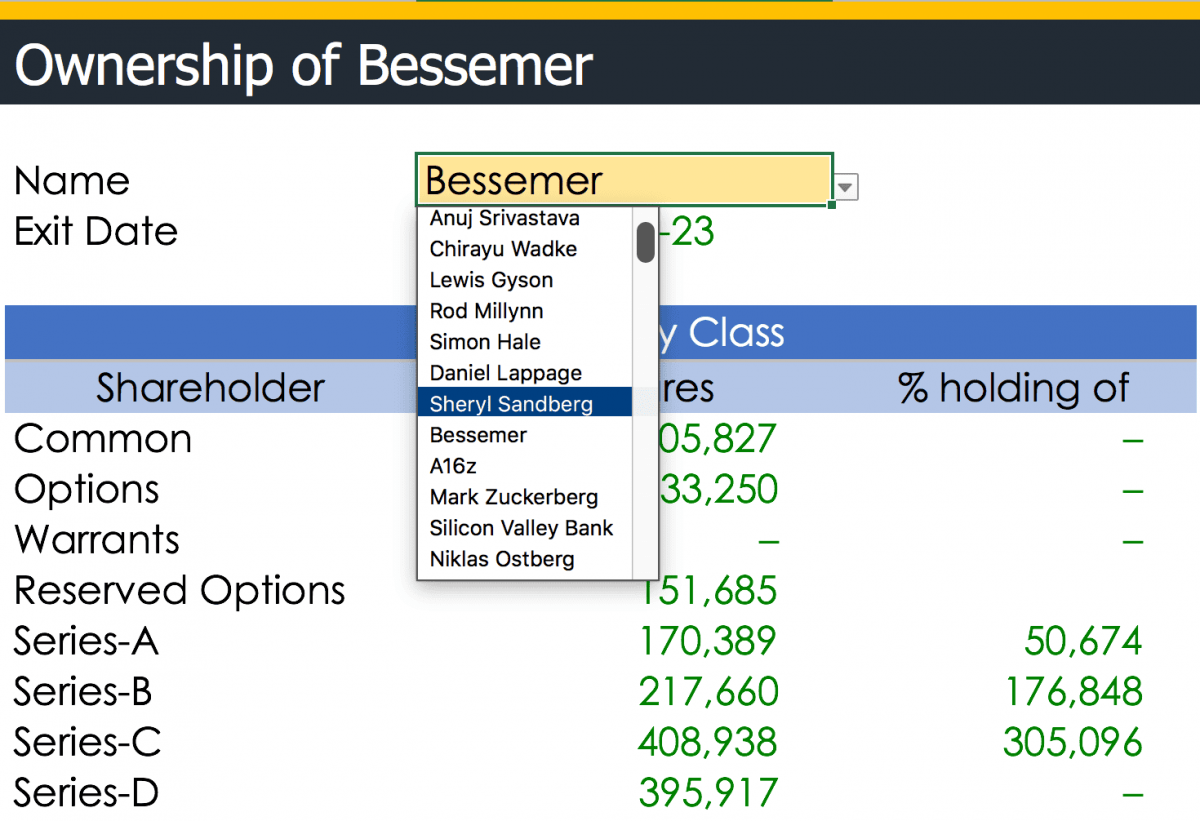
There is a shareholder schedule to keep an overview of all shareholders. This acts as a dropdown menu for the other sheets so that the ‘shareholder name’ will appear in each and every other sheet.
First, input all the shareholders on this sheet and add any key details. You can use this as an aide memoir to ensure that you add in shareholder details to each sheet properly. I make sure I do this when testing the sheet and ensuring I input everything properly.

All the calculations for calculating deal pricing are kept on one sheet. You can see all the assumptions that are fed in explicitly stated.
I originally had these on other sheets but found it was easier to have a nice consistent overview of all your transactions. If anything doesn’t look right, it’s easy to see.
We also have some checks on the page so you can see that things add up. If you look closely you will see a ‘-1’ in some of the checks- what the heck is that? Don’t worry, in transactions you don’t have perfect share counts since shares don’t round perfectly. You need to decide how to account for ‘fractionalised shares.’ This isn’t a problem, you just need to decide what you want to do, like give the extra share to a founder.
You can also see how pro-rata calculations are done. A cool thing I built in the model is the ability to press a button and automatically pro-rata investors. This is really handy if you want to run some scenarios about what dilution might look like. Normally, that would involve a load of manual inputs, which would take time to do. I’ve tried to make this pretty simple.

The calculations continue, giving you a round-by-round overview of who owns what by class of share on a fully-diluted basis. Everything will add up to 100%.

Every sheet, from common to preference series and warrants and options have their own sheet. They are set out nice and clear as follows.
![]()
All the ledgers present in the capitalization table sheet have a consistent format. You only need to pick their name from a drop-down list to add new staff/investors.
There is a capitalization table for common (the starting sheet) up to series-I. I made sure that you will be able to cover as many rounds as possible!
If you do a series-aa, no worries, it’s just another class of share. The model allows you to have 9 series of preference shares, on top of common types. That’s a lot!
Holy hell, Batman! 9 classes! That sounds complicated! Dude, you don’t need to touch anything in the future, you can only focus on a seed round if you want. The model allows you to do a whole lot of complicated stuff, but also to be as simple as possible.
Just be logical, fill in the boxes (They are yellow!) and you are cool. You don’t need to deal with any crazy stuff like restricted shares if you don’t need to… but if you want to, you can! I did the thinking for you (and it was painful to make this simple!).

Here is an example of the series-A capitalization table. You input the name from the drop-down menu and the sheet populates.
It’s the same format as the common example above, only you get two more shiny boxes!
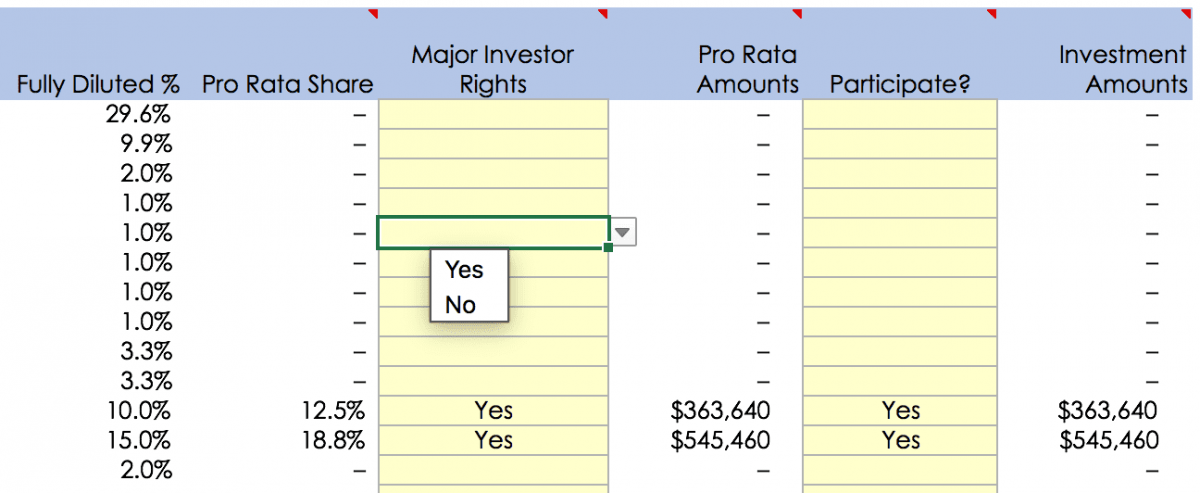
For the next round, you can insert whether an investor has ‘majority investor rights‘ and if they ‘participate‘ for their pro-rata. This basically enables you to ‘auto-pro-rata’ investors, which is handy if you want to forecast scenarios.

Here is the series-I sheet. You can see in the last three rows before the summary that the plugs have been used. If you want to run scenarios to see ownership across a range of values, the model lets you easily forecast this! Cool beans 😉
Now, you literally don’t have to touch the sheet for running scenarios. You do this from the assumption sheet, but to make it work, I added some dinky little formulas to help.

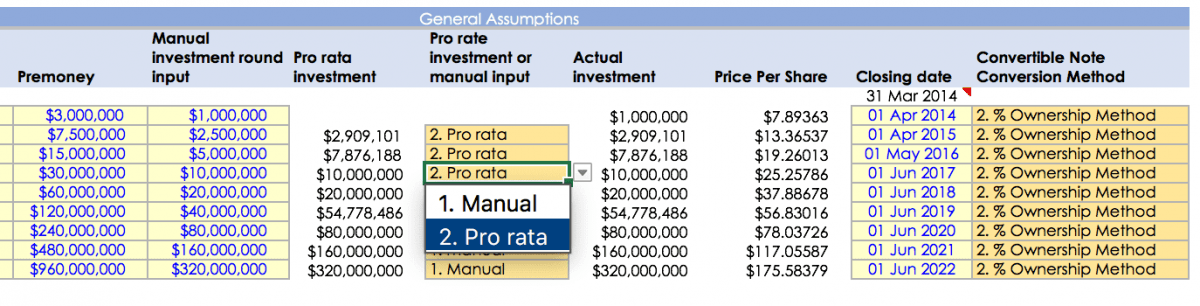
The inputs for all your fundraises are on the assumption sheet. Each round is on one line. To make them graphical, I’ve separated them into two pictures.
Don’t freak out. There are a lot of boxes, I know! But they are there to cover all the assumptions you need.
To add a series-a round, you input the pre and post-money and the date of closing. If there were convertible notes, then pick the method from the drop-down menu and the model does all the calculations for you. If you don’t have CNs, then they don’t matter!
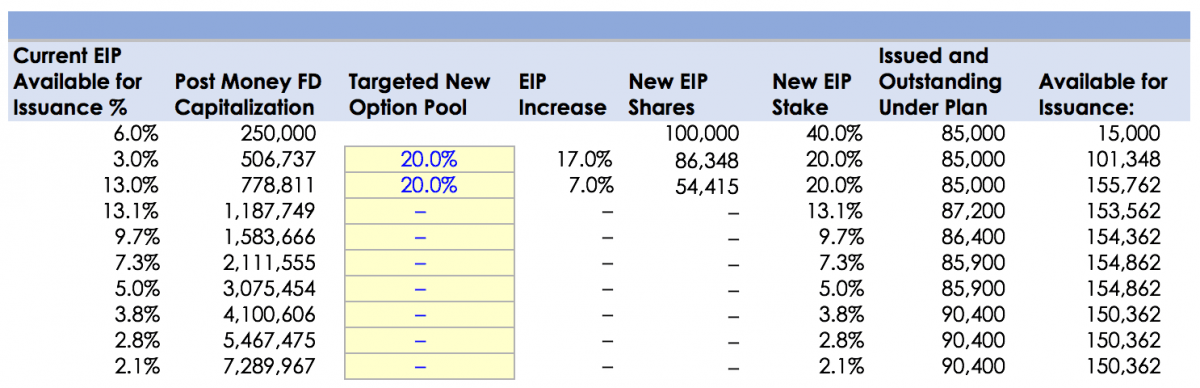
To add an ESOP pool at a post-money level, you just type in the % you want. To add multiple liquidation preferences, you just pop them in the last column.


Individual returns
You can see the return profile of every investor by simply picking their name from a drop-down menu. Once you click the name, the chart and calculation fields all populate. This is a great means by which you can show staff what they own, or might own depending on assumptions.

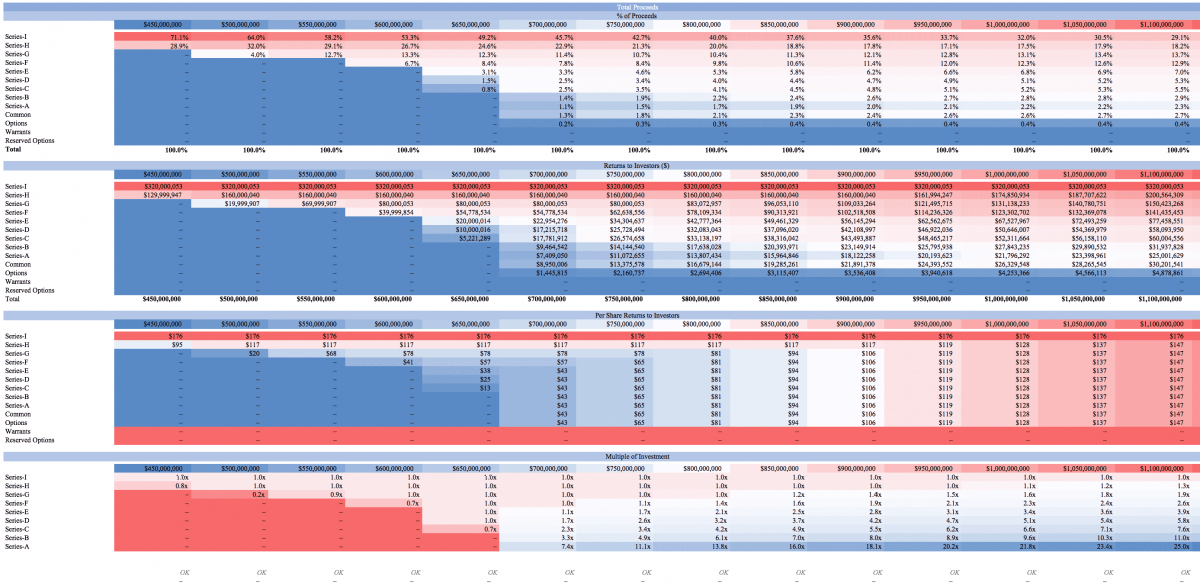
Waterfall returns
To understand who will get what at an exit, for a range of values, you need to make a returns waterfall (which is no easy feat, trust me! I spent two weeks trying to find a friend in private equity who could do this and nada, till I figured it out… eventually).
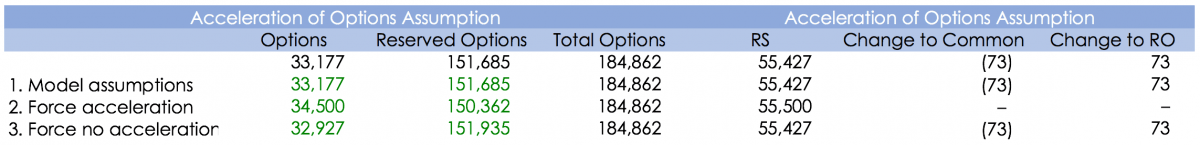
The model allows you to see what happens if you accelerate options, or even remove unissued options, from the diluted shares.
It would take me a blog to explain some of the cool calcs here, but you can decide what happens to options is various scenarios, with the press of a drop-down menu.

You can see the effect of acceleration and the option you pick.
Here you can see some of the calculations at the top of the waterfall. Yeah, this wasn’t fun to figure out!

At the end of the model, you can see how much each class of investors owns. this is split out between preference, common and total returns. You can also see the per share ($) returns as well as the multiple of investments returned. This is mapped out by each class of shares.
Ownership sheets
In the ESOP sheet, you record the options held by staff. Yes, restricted stock is issued from the ESOP… did I just scare you? A proper capitalization table is like a double entry ledger, only you probably haven’t seen that before. You can geek out like a lawyer would here. And by the way, it is easy to add in a thousand line items for all you care. I made it easy for you to do so. The simplest things are the hardest to do.

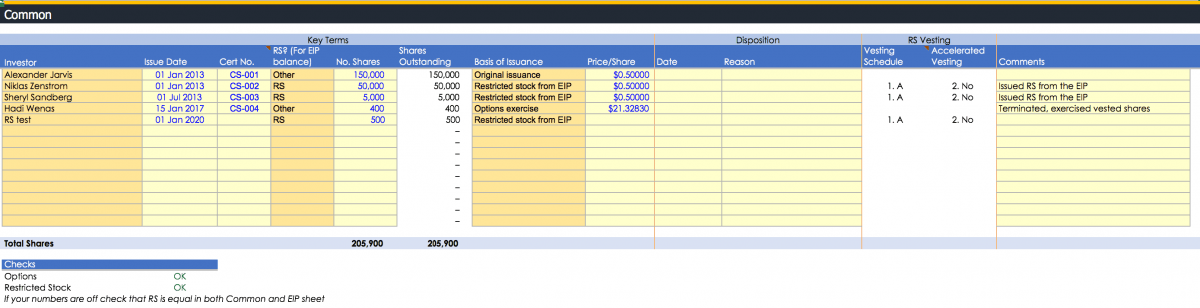
Founders and staff, as well as any other common owners of common stock, are recorded in the common ledger. Any options exercised are moved from the ESOP to the common ledger. You deduct them from the ESOP so you know what is left outstanding. you will need to keep increasing the ESOP over time to meet staff demands (and those of investors)
Whenever you issue convertible notes, you input the key details in the convertible ledger. All you need to do is input the principal, interest, cap and discount. All the complicated calculations such as the shares issued and the effective discount rate are calculated. You may have read my blog on how to calculate convertible notes under the three scenarios. Here you don’t need to do any math at all, you just pick the flavour you want. Easy.

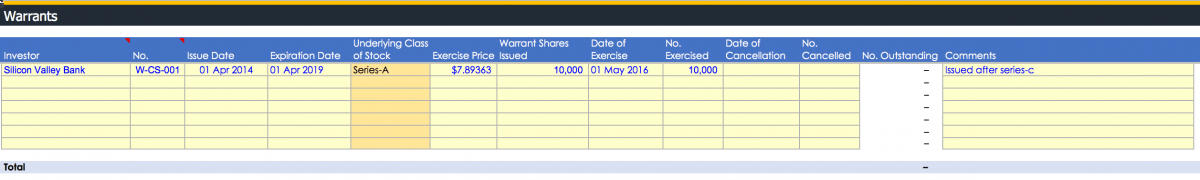
Warrants are not common, but you see them when warranted (I hate myself for making a pun there…). If you happen to have warrants, chuck them in the warrants sheet. Simples.
From Series-A to I you have one schedule to input your classes of shares. This is not only powerful but extensible and clean. Capitalization table can get really messy, so splitting things up makes things better. I did the thinking for you.
![]()
If you have convertible holders which convert into S-A, this is the sheet where they would convert. Of course, convertibles are way more complicated than one might think. Actually, most people don’t know that… I’ve made it simple for you for all your principal requirements.

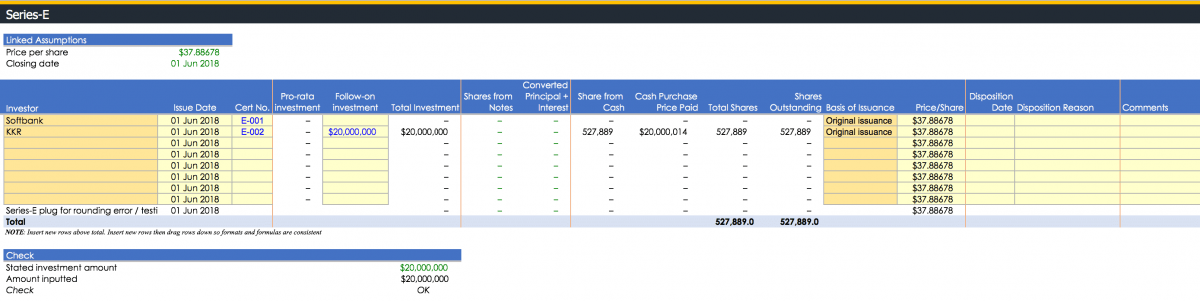
At your Series-E you raise $20m from two investors. You add them on two lines with only a few inputs.
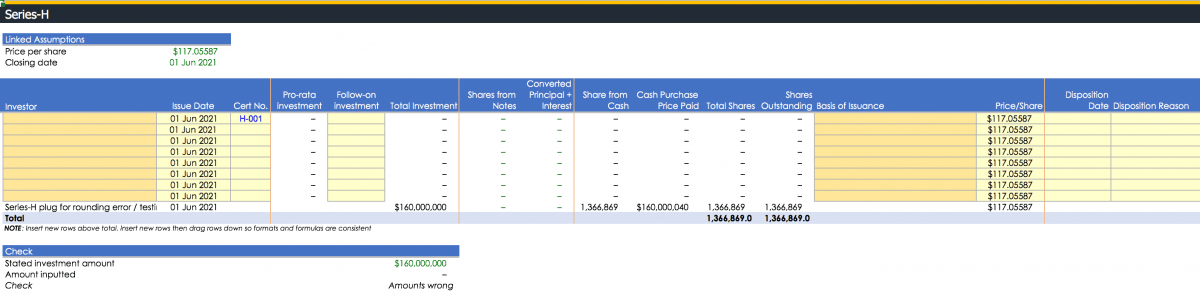
You want to see what happens if you did a series-H, but manually having to change every sheet is a pain! So each page has a plug linked to the assumption sheet. Easy. You didn’t even need to touch this sheet if you wanted to forecast the dilution effect… of a $160m raise! I wish the best for you 😉
Some details
Unbeknownst to many, there are three manners through which convertible notes convert. In this model, accounting for all this complexity is as easy as clicking in a drop-down.

If you want investors to take their pro-rata in a deal, that can be a little hard to calculate. In this model, it’s again as easy as clicking yes or no. Let’s be honest, you need to do a few calcs, but I made them for you.
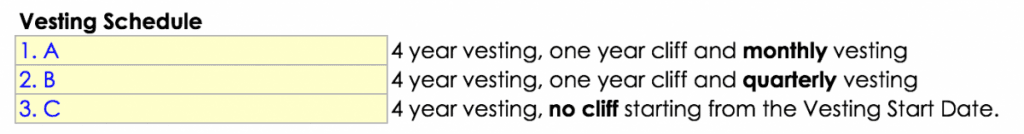
The model has built-in three vesting schedules to pick from (you can build your own if you do something weird). I’ve built the three most common options (though only two are at all common).
Acceleration of options can be an important consideration to your staff. The model allows you to control what happens in a change of control. The returns waterfall lets you override the model assumptions with full and no acceleration… just in case an acquirer wants to screw your terms (which happens).
 Giving investors pro-rata rights is incredibly simple.
To set your ESOP target per round is as easy as adding a percentage. All the calcs are done for you.
Yes, you HAVE to have iterative calculations turned on in tools/calculations. I hate putting this in models as it makes it unstable, but given how complicated some calculations are, and to do the heavy lifting for you, there is no way around it. I apologise for trying to make things easy for you! The devil always needs to be paid 😉
It’s easy to change who returns you want to see, as it’s all in a drop-down menu. Simply change the name, and the whole sheet will too. Literally, one change of a name and everything will change. Don’t burn me as a witch for the magic 😉
The format page sets out the assumptions for drop-down menus. It also is used to explain what the assumptions mean. You shouldn’t change anything on this sheet.
There is a shareholder schedule to keep an overview of all shareholders. This acts as a dropdown menu for the other sheets so that the ‘shareholder name’ will appear in each and every other sheet..
First, input all the shareholders on this sheet and add any key details. You can use this as an aide memoir to ensure that you add in shareholder details into each sheet properly. I make sure I do this when testing the sheet and ensuring I input everything properly.
All the calculations for calculating deal pricing are kept on one sheet. You can see all the assumptions that are fed in explicitly stated.
I originally had these on other sheets but found it was easier to have a nice consistent overview of all your transactions. If anything doesn’t look right, it’s easy to see.
We also have some checks on the page so you can see that things add up. If you look closely you will see a ‘-1’ in some of the checks- what the heck is that? Don’t worry, in transactions you don’t have perfect share counts since shares don’t round perfectly. You need to decide how to account for ‘fractionalised shares.’ This isn’t a problem, you just need to decide what you want to do, like give the extra share to a founder.
You can also see how pro-rata calculations are done. A cool thing I built in the model is the ability to press a button and automatically pro-rata investors. This is really handy if you want to run some scenarios about what dilution might look like. Normally, that would involve a load of manual inputs, which would take time to do. I’ve tried to make this pretty simple.
The calculations continue, giving you a round-by-round overview of who owns what by class of share on a fully-diluted basis. Everything will add up to 100%.
Every sheet, from common to preference series and warrants and options has their own sheet. They are set out nice and clear as follows.
All the ledgers present in the capitalization table sheet have a consistent format. You only need to pick their name from a drop-down list to add new staff/investors.
There is capitalization tables for common (the starting sheet) up to series-I. I made sure that you will be able to cover as many rounds as possible!
If you do a series-aa, no worries, it’s just another class of share. The model allows you to have 9 series of preference share, on top of common types. That’s a lot!
Holy hell, Batman! 9 classes! That sounds complicated! Dude, you don’t need to touch anything in the future, you can only focus on a seed round if you want. The model allows you to do a whole lot of complicated stuff, but also to be as simple as possible.
Just be logical, fill in the boxes (They are yellow!) and you are cool. You don’t need to deal with any crazy stuff like restricted shares if you don’t need to… but if you want to, you can! I did the thinking for you (and it was painful to make this simple!).
Here is an example of the series-A capitalization table. You input the name from the drop down menu and the sheet populates.
It’s the same format as the common example above, only you get two more shiny boxes!
For the next round you can insert whether an investor has ‘majority investor rights’ and if they ‘participate’ for their pro-rata. This basically enables you to ‘auto-pro-rata’ investors, which is handy if you want to forecast scenarios.
Here is the series-I sheet. You can see in the last three rows before the summary that the plugs have been used. If you want to run scenarios to see ownership across a range of values, the model lets you easily forecast this! Cool beans 😉
Now, you literally don’t have to touch the sheet for running scenarios. You do this from the assumption sheet, but to make it work, I added some dinky little formulas to help.
The inputs for all your fundraises are on the assumption sheet. Each round is on one line. To make them graphical, I’ve separated them into two pictures.
Don’t freak out. There are a lot of boxes, I know! But they are there to cover all the assumptions you need.
To add a series-a round, you input the pre and post-money and the date of closing. If there were convertible notes, then pick the method from the drop-down menu and the model does all the calculations for you. If you don’t have CNs, then they don’t matter!
To add an ESOP pool at a post-money level, you just type in the % you want. To add multiple liquidation preferences, you just pop them in the last column.
Individual returns
You can see the return profile of every investor by simply picking their name from a drop-down menu. Once you click the name, the chart and calculation fields all populate. This is a great means by which you can show staff what they own, or might own depending on assumptions.
Waterfall returns
To understand who will get what at an exit, for a range of values, you need to make a returns waterfall (which is no easy feat, trust me! I spent two weeks trying to find a friend in private equity who could do this and nada, till I figured it out… eventually).
The model allows you to see what happens if you accelerate options, or even remove unissued options, from the diluted shares.
It would take me a blog to explain some of the cool calcs here, but you can decide what happens to options is various scenarios, with the press of a drop-down menu.
You can see the effect of acceleration and the option you pick.
Here you can see some of the calculations at the top of the waterfall. Yeah, this wasn’t fun to figure out!
At the end of the model, you can see how much each class of investors owns. this is split out between preference, common and total returns. You can also see the per share ($) returns as well as the multiple of investments returned. This is mapped out by each class of shares.
Ownership sheets
In the ESOP sheet, you record the options held by staff. Yes, restricted stock is issued from the ESOP… did I just scare you? A proper capitalization table is like a double entry ledger, only you probably haven’t seen that before. You can geek out like a lawyer would here. And by the way, it is easy to add in a thousand line items for all you care. I made it easy for you to do so. The simplest things are the hardest to do.
Founders and staff, as well as any other common owners of common stock, are recorded in the common ledger. Any options exercised are moved from the ESOP to the common ledger. You deduct them from the ESOP so you know what is left outstanding. you will need to keep increasing the ESOP over time to meet staff demands (and those of investors)
Whenever you issue convertible notes, you input the key details in the convertible ledger. All you need to do is input the principal, interest, cap and discount. All the complicated calculations such as the shares issued and the effective discount rate are calculated. You may have read my blog on how to calculate convertible notes under the three scenarios? Here you don’t need to do any math at all, you just pick the flavour you want. Easy.
Warrants are not common, but you see them when warranted (I hate myself for making a pun there…). If you happen to have warrants, chuck them in the warrants sheet. Simples.
From Series-A to I you have one schedule to input your classes of shares. This is not only powerful but extensible and clean. Capitalization table can get really messy, so splitting things up makes things better. I did the thinking for you.
If you have convertible holders which convert into S-A, this is the sheet where they would convert. Of course, convertibles are way more complicated than one might think. Actually, most people don’t know that… I’ve made it simple for you for all your principal requirements.
At your Series-E you raise $20m from two investors. You add them on two lines with only a few inputs.
You want to see what happens if you did a series-H, but manually having to change every sheet is a pain! So each page has a plug linked to the assumption sheet. Easy. You didn’t even need to touch this sheet if you wanted to forecast the dilution effect… of a $160m raise! I wish the best for you 😉
Some details
Unbeknownst to many, there are three manners through which convertible notes convert. In this model, accounting for all this complexity is as easy as clicking in a drop-down.
If you want investors to take their pro-rata in a deal, that can be a little hard to calculate. In this model, it’s again as easy as clicking yes or no. Let’s be honest, you need to do a few calcs, but I made them for you.
The model has built-in three vesting schedules to pick from (you can build your own if you do something weird). I’ve built the three most common options (though only two are at all common).
Acceleration of options can be an important consideration to your staff. The model allows you to control what happens in a change of control. The returns waterfall lets you override the model assumptions with full and no acceleration… just in case an acquirer wants to screw your terms (which happens).
Giving investors pro-rata rights is incredibly simple.
To set your ESOP target per round is as easy as adding a percentage. All the calcs are done for you.
Yes, you HAVE to have iterative calculations turned on in tools/calculations. I hate putting this in models as it makes it unstable, but given how complicated some calculations are, and to do the heavy lifting for you, there is no way around it. I apologise for trying to make things easy for you! The devil always needs to be paid 😉
It’s easy to change who returns you want to see, as it’s all in a drop-down menu. Simply change the name, and the whole sheet will too. Literally, one change of a name and everything will change. Don’t burn me as a witch for the magic 😉