
Walk through of some key features of the sheets in the SaaS financial model
There is a lot in this model. I can't possibly explain all the details involved, and neither do you want to read it ;). I've whacked in a screenshot per sheet so you have an idea what is going on. If you want to see me explain it in more detail watch the videos. This should give you an idea of the magnitude of how much there is in this model and the time I put into making it.
Table of Contents (Click to section)
- SaaS Model Architecture
- Formatting Sheet
- Detailed Profit And Loss Statements
- Depreciation And Tax
- Historic annual contacts
- Detailed KPI Sheet
- Runway Calculator
- Staff And General Costs
- Payment And Tech Expenses
- Sales team
- Sales team
- Expansion Revenue
- Professional Services
- Pricing Sheet
- Cohort Power
- Conversion Assuptions
- Complete marketing
- Paid And Organic Marketing
- Email Marketing
- Blog & Social
- Channel Sales
The SaaS model architecture
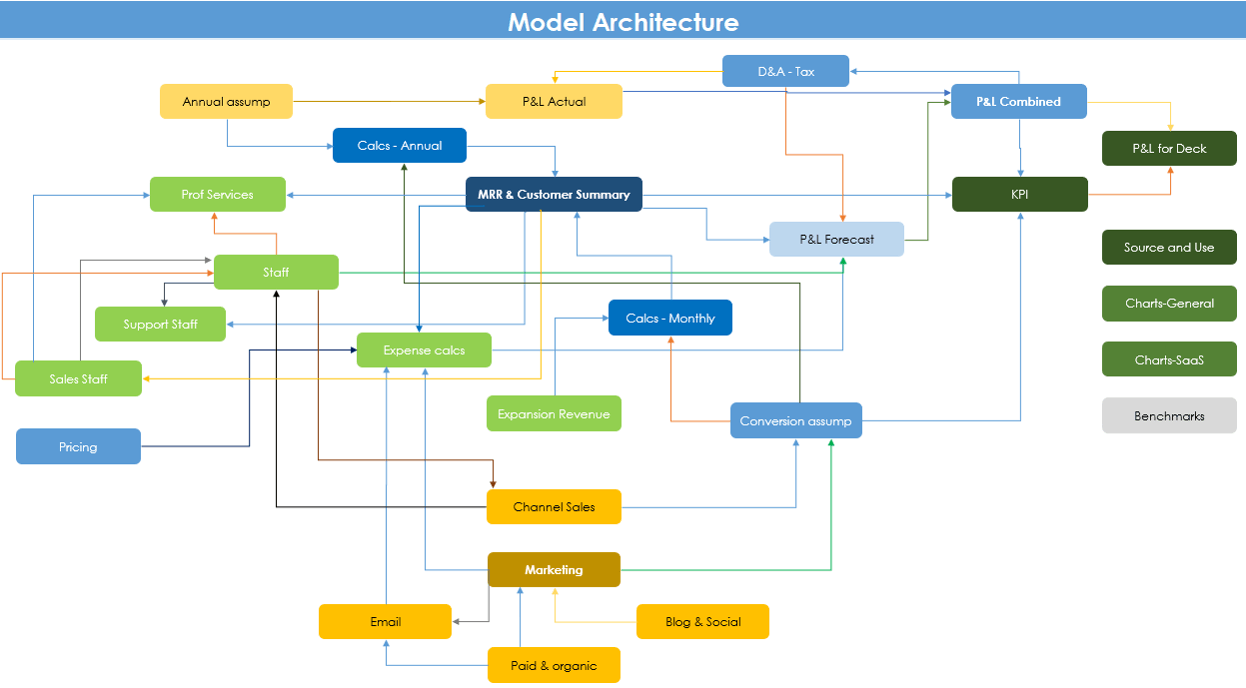
- Fully integrated model: Changes in one sheet flow through the whole model automatically
- Logical flow: Expenses, marketing and revenue are all segmented so they connect logically
- P&Ls: Actuals and forecasts have their own P&Ls. These are then combined into a 'combined sheet' so you can see the progress month to month
- Other: Charts and KPIs have their own sheets. The key data from the large calculation sheets are presented so you don't have to dive into them
Formatting sheet
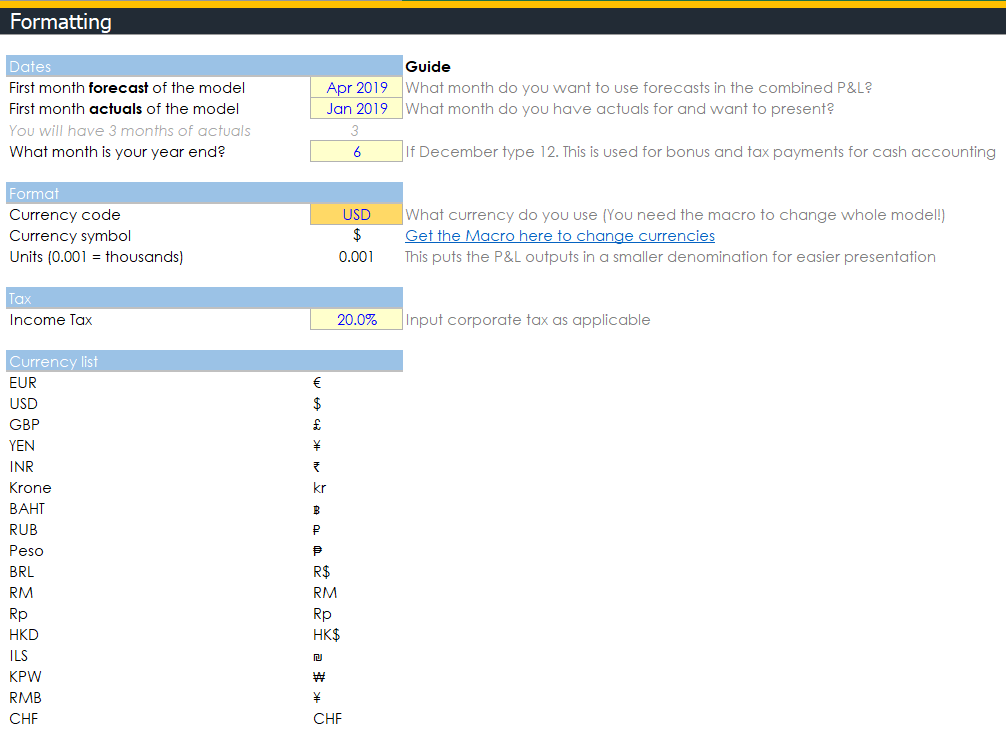
- Actual start: You can add up to 11 months in the actual sheet (12m is a historic, right?)
- Forecast date: Forecast sheet has 36 months of forecast
- Constantly update your model: I spent 2 weeks just figuring out a way to constantly update your model. You start with your Actual start date, then you can move your forecast month forward as time goes by. You then add your new actual month in
- Month end: Set your month end. Your annual bonus, tax etc will be paid out that month in the CFS, but accrue in the P&L as usual
- Currency change: With my plugin, you can switch to all the currencies you can see in the list
Detailed Profit and Loss statements
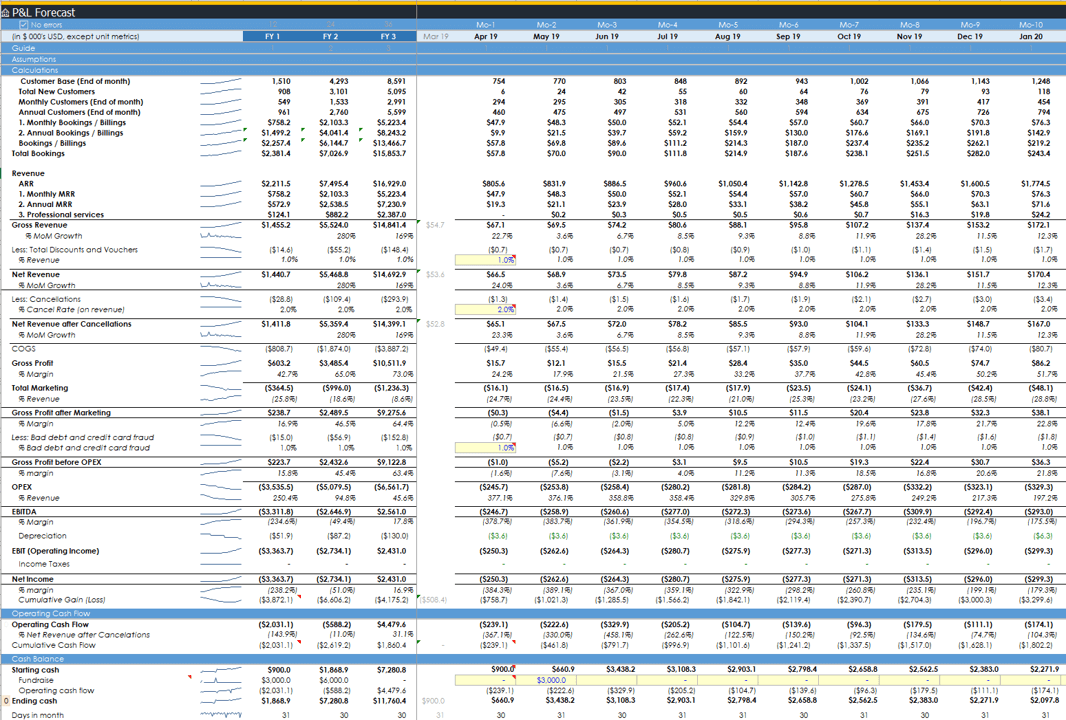
- 3 P&L sheets: Actual, forecast and combined
- Non key assumptions in line: If you want to add discounts, cancellations and bad debt, you can easily add in a percentage in line
- Fundraising: When you plan on raising money, you just input the amount into your cash balance
- Accounting and cash flow: Two main parts. The main part follows normal accounting practices (There is a sheet for Tax to manage NOLs as well as depreciation and amortisation following Investment Banking standards). The bottom of the sheet converts accounting to operating cash flow so you know when money is actually going in and out
- Complex adjustments: Bonuses are paid on year end in cash flow, but accrue in the P&L. Same for tax. Accrued bonuses from actuals are factored into your forecast for when they need to be paid
Depreciation and tax
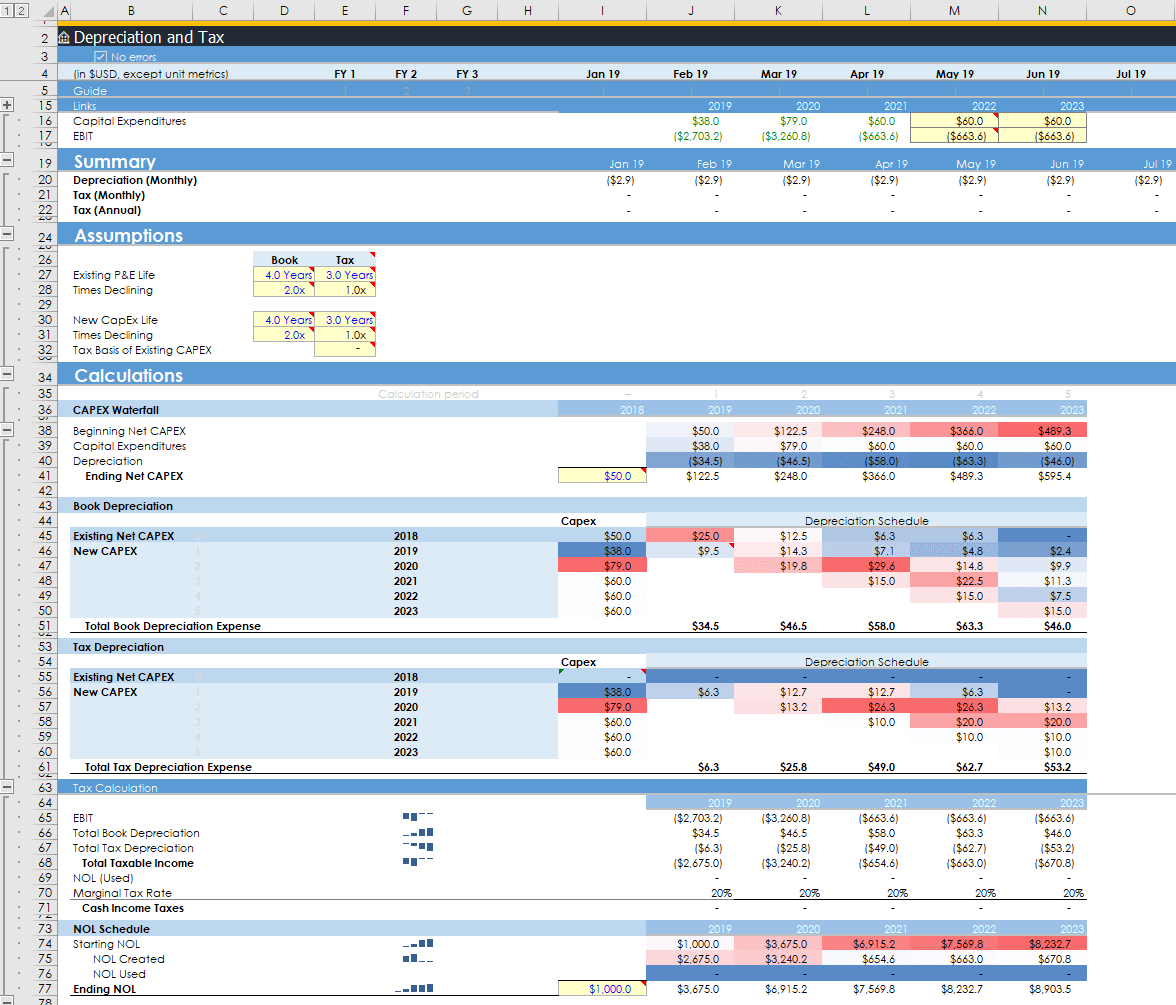
- Control depreciation and tax: Simply manage the boring accounting bits with only a few assumptions like an M&A banker would
- Depreciation: Accounting for depreciation
- Tax: Calculate when you need to actually pay tax. Net Operating Losses (NOL) accounted for
- UPDATE COMING: I hired an accountant to add more boring nerd stuff to include R&D capitalisation etc. I'm not adding amortisation of intangibles because you're not a big corporation... I purposefully only add what might be useful
Historic annual contracts renew on time
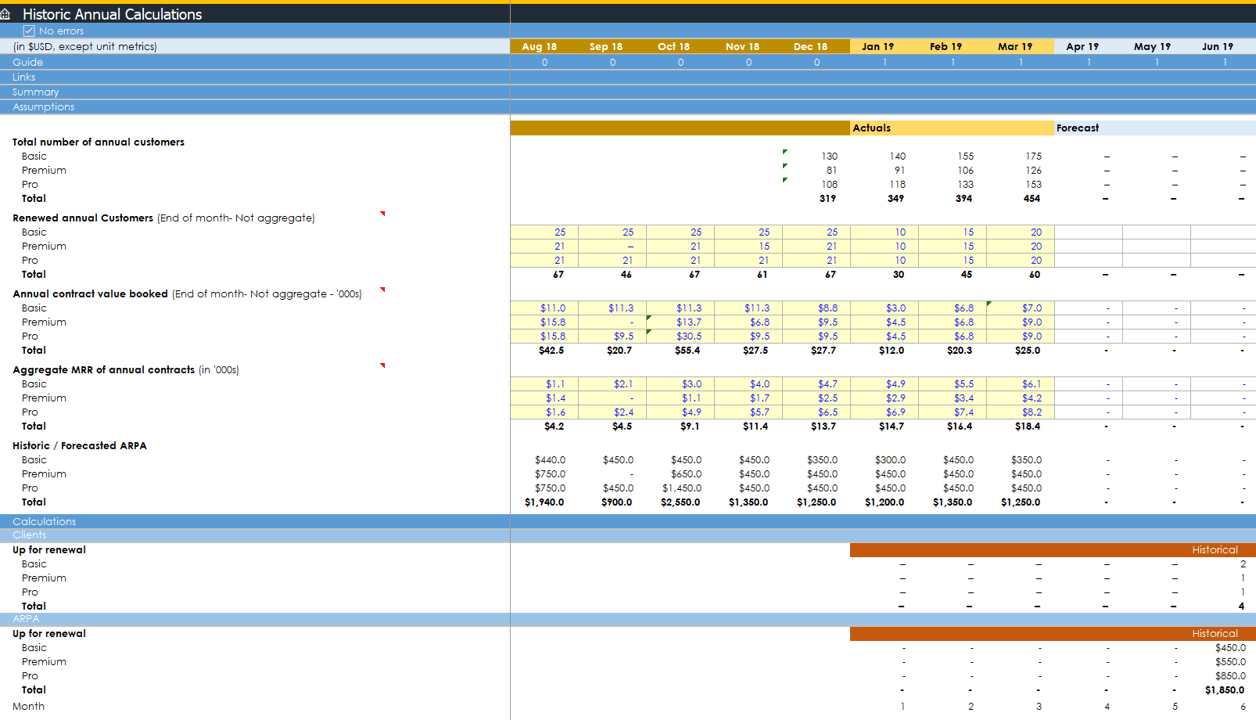
- Scheduled contracts: If you have a lot of historic annual SaaS payments, then they need to renew at the right month in the future. The model enables you do do
- Renew at new prices: If your old contracts were at $450 per year, but you have increased prices to $1000 a year, the model increases your ARR/MRR by the new prices!
- Churn at old prices: When clients churn in the model, you lose MRR at the original ARPA, just like you should
- Simple: If you know how many clients you have each month and the ARPA, that's all you need to account for your historic revenue
Detailed KPIs (186 rows)
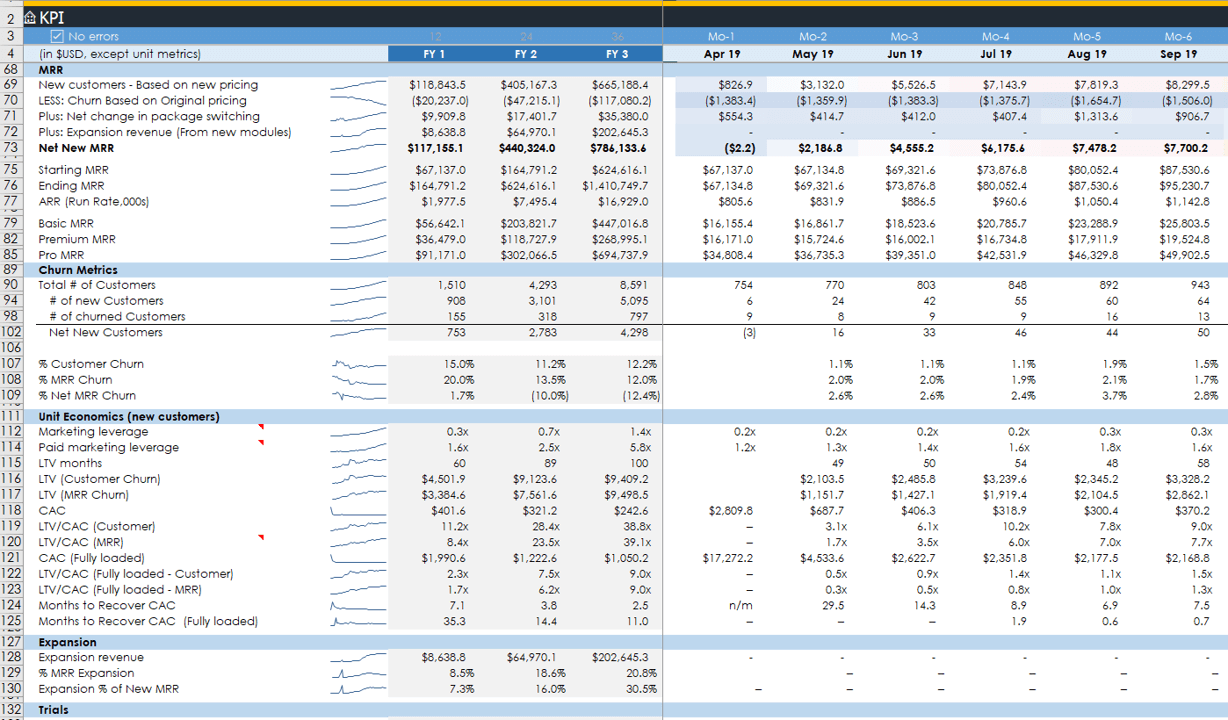
- Detailed KPIs: 186 rows of every KPI I could think of
- CAC/LTV: See your key KPIs calculated with based on both customer and MRR churn. There are also basic and fully loaded variants
- Segments: KPIs for key financials, margins, cost structures, cash burn rate, bookings, MRR, churn, unit economics, expansion revenue, trials, funnel metrics, headcount, and professional services
- Dates: Both monthly and annual KPIs
Runway calculator
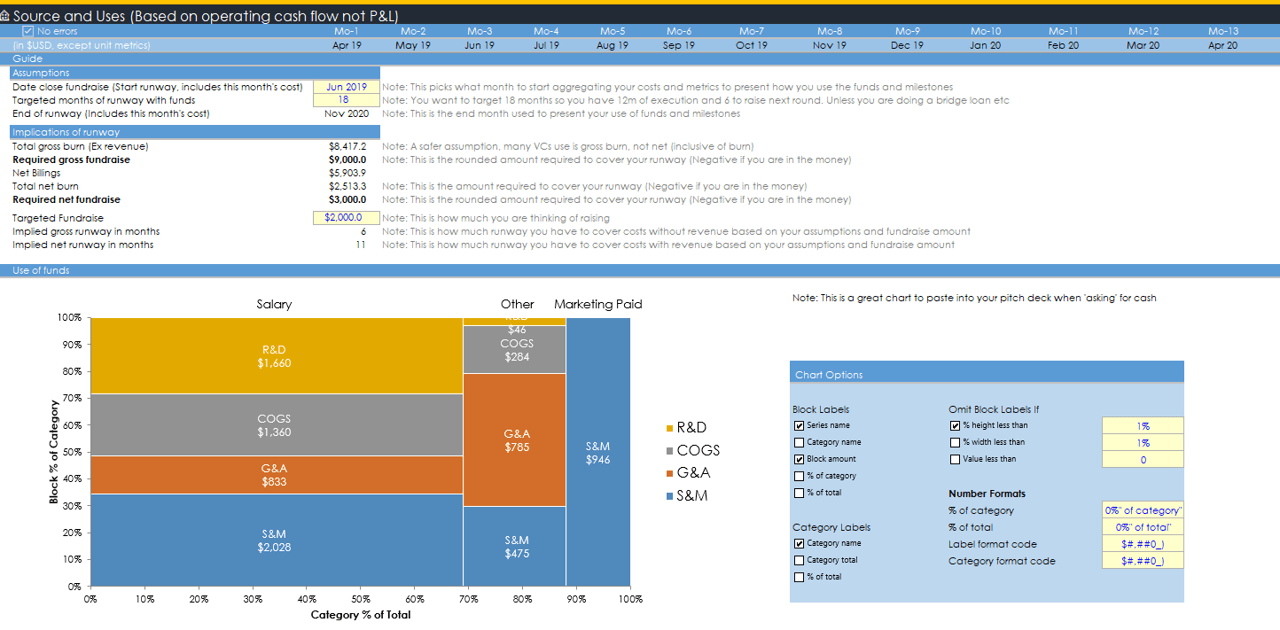
- Runway calculations: Understand your gross and net burn over your defined runway (in months). See how many months your planned fundraise will last based on your model forecasts
- Detailed operating expenses: See exactly where money is being spend per department over your runway
Staff and general costs can be detailed or basic
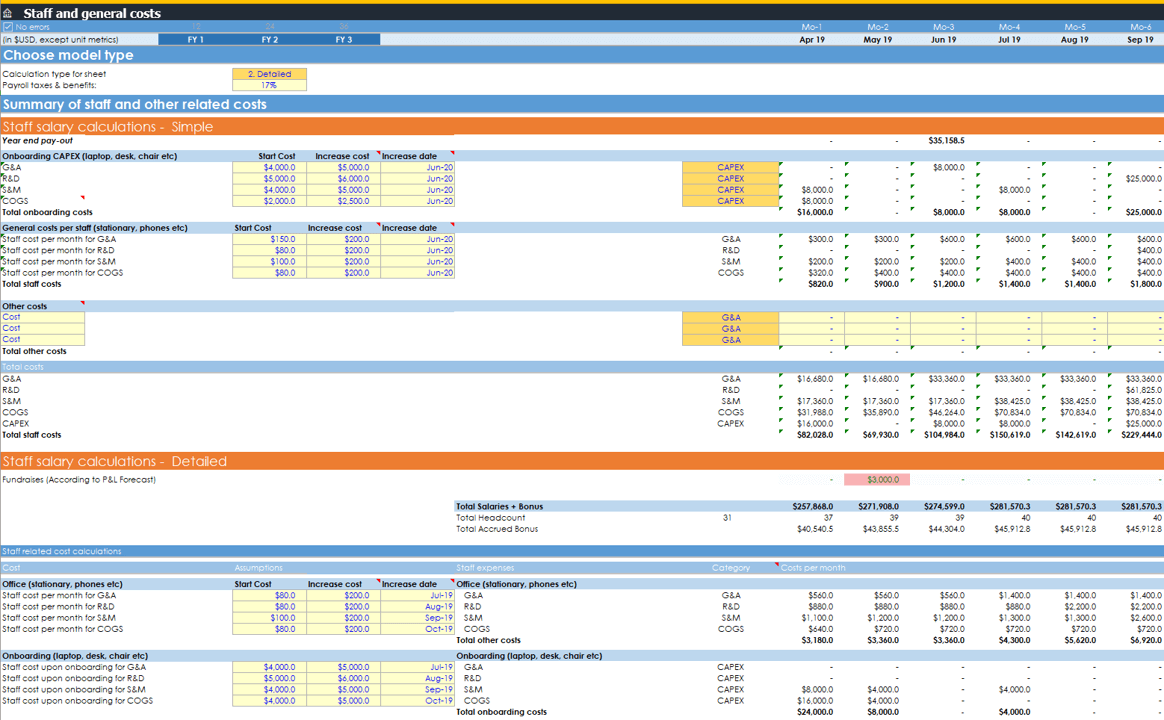
- 2 methods for forecasting staff: Switch between the basic and detailed method for forecasting your staff requirement. If you want to fill in the model faster, choose the basic option. If you have a detailed hiring plan, pick the detailed version
- Automatic forecasting: Sales staff, customer care etc can automatically be calculated in other sheets. These feed into both the basic and detailed version so you can choose how detailed you want to be with a flick of some switches.
- Scale recruitment as you need: Opt to hire recruiters when you hire [5 or more] new people a month so you don't have to think about how many recruiters you need
- Granular control over hiring: Easily add benefits/tax, choose the date you hire/fire staff and the date you want to increase their salary (say at Series-A)
- Other costs: Quickly add all the 'other' costs you need like rent, onboarding costs (e.g. laptops) of staff, and whatever costs you need without having to over think it. Most costs are calculated my multiplying the average cost be the number of staff you have
Automated expense sheet
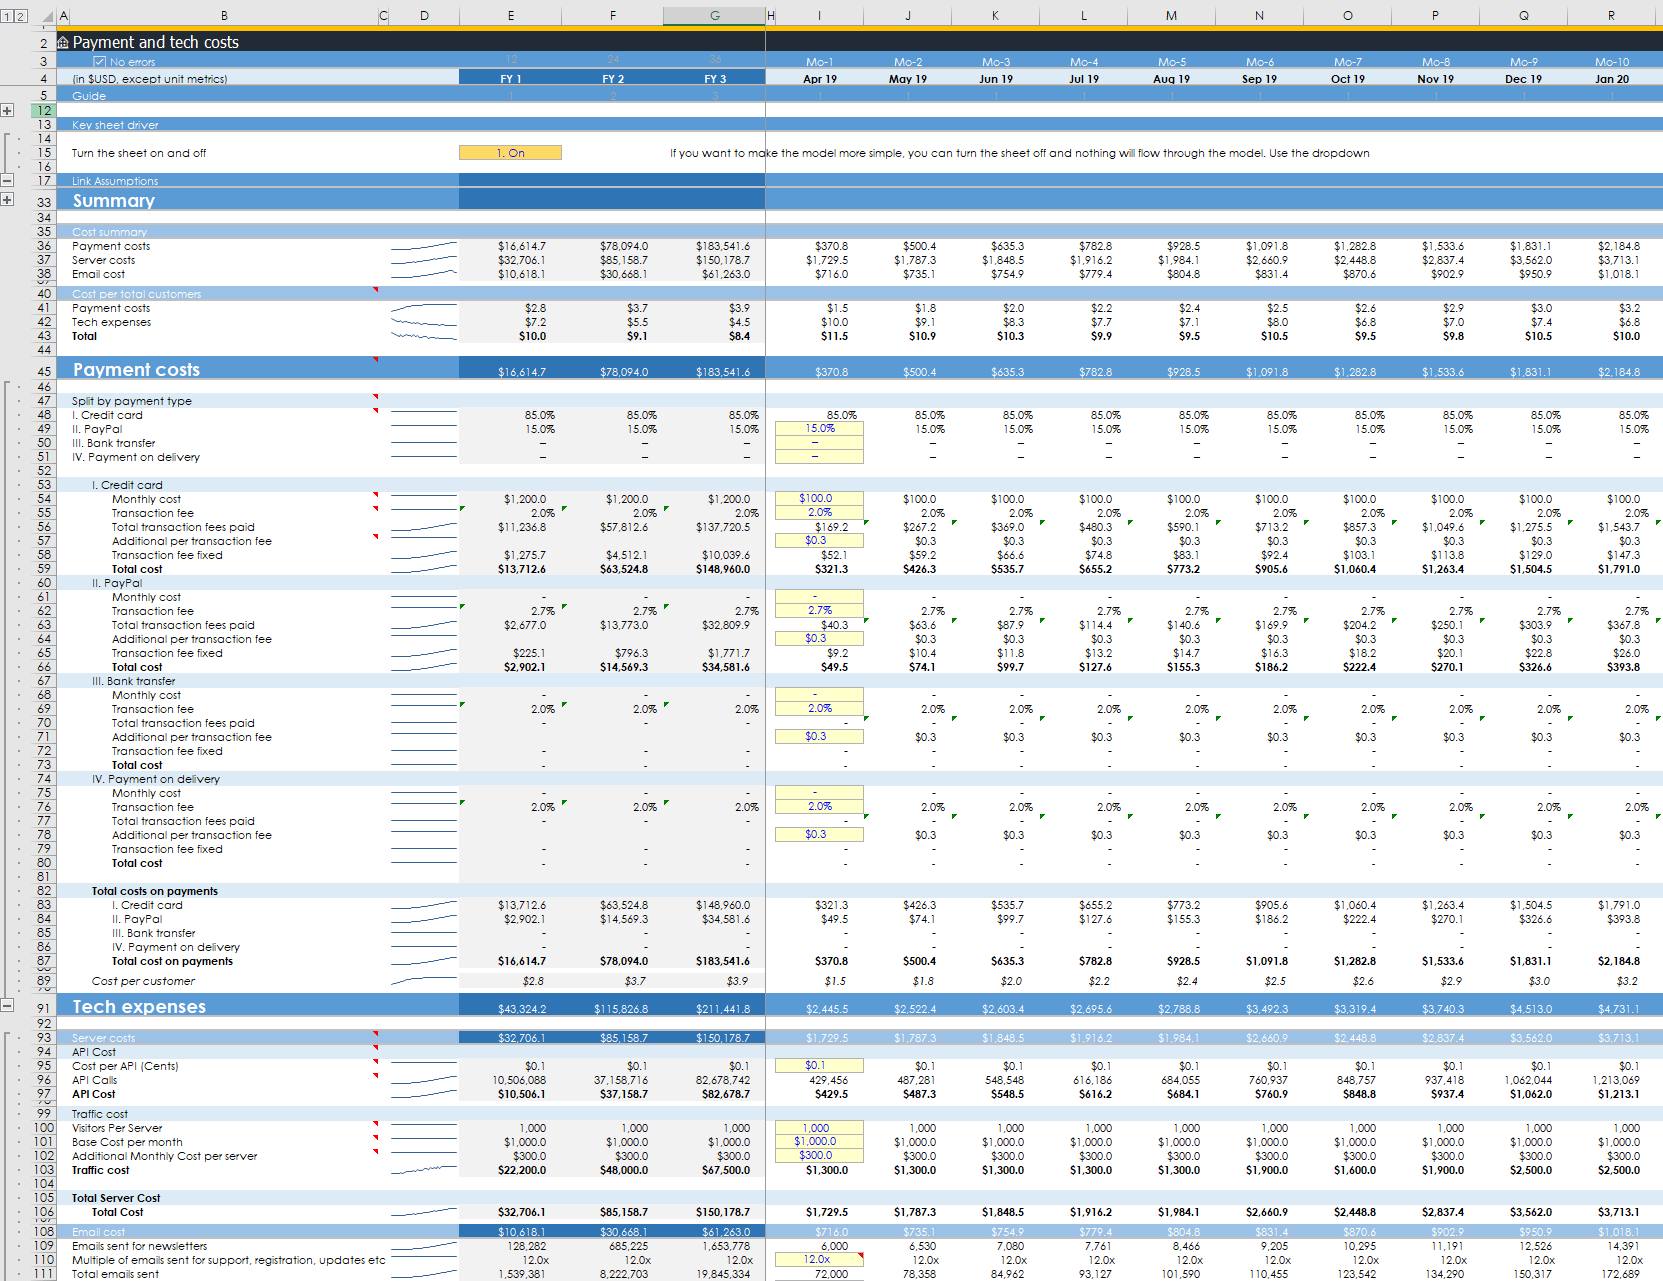
- Payment costs: Simply manage your payment costs with credit card, PayPal, bank transfer and payment on delivery.
- Tech costs: Automate server and email costs. You can build this out if it is a big deal to you
The sales team ramps up to productivity
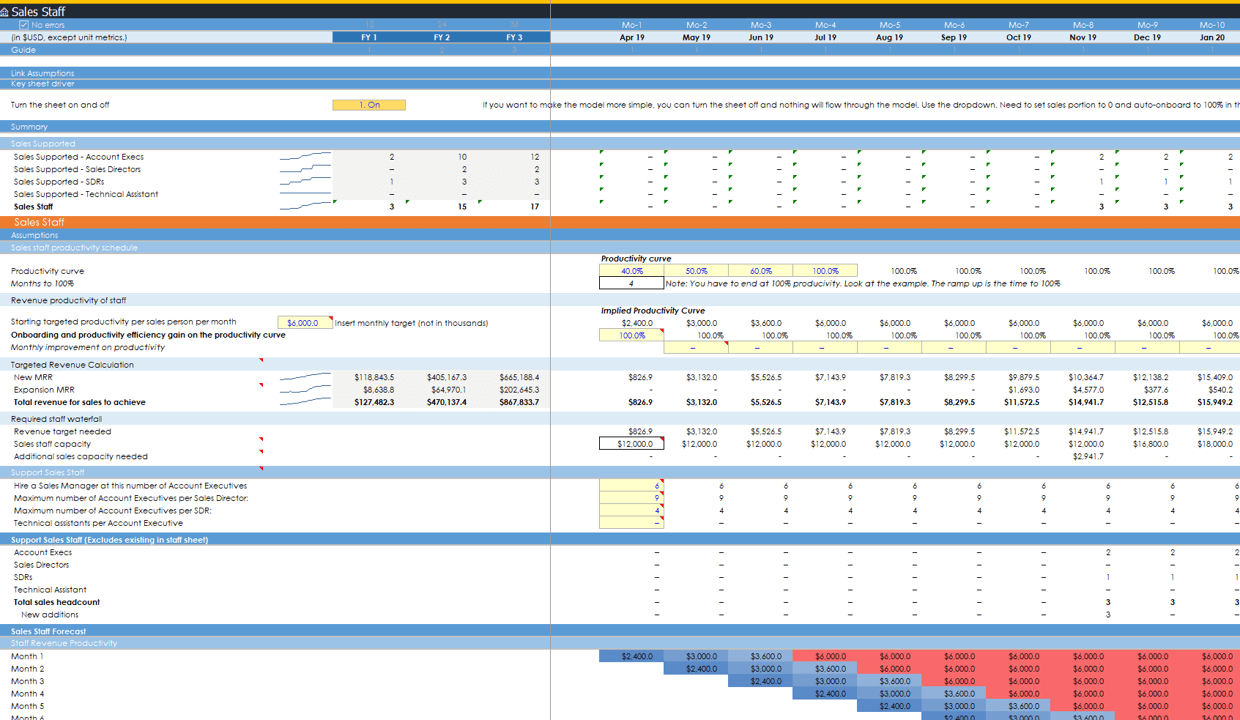
- Build a sales team: Easily build a sales organisation with account execs (AEs), sales directors, SDRs and tech assistants. They scale by the number of AEs you need to hire to hit your targets. You only need to make 6 assumptions to make this all work
- Productivity ramps: Define how many months it takes for new AEs to hit their quota
- Hiring based on revenue targets: You define what % of your revenue is sales supported and what the revenue target of an AE is, and the model knows your existing capacity and tells you how many people you need
- Integrated into the staff sheet: Sales staff are fed into the main staff sheet so everyone can be seen in the same place
- Cohorts: Cohort modeling knows what is required on a monthly basis. You can't get more detailed and accurate than that
Customer care, success and engineering automated
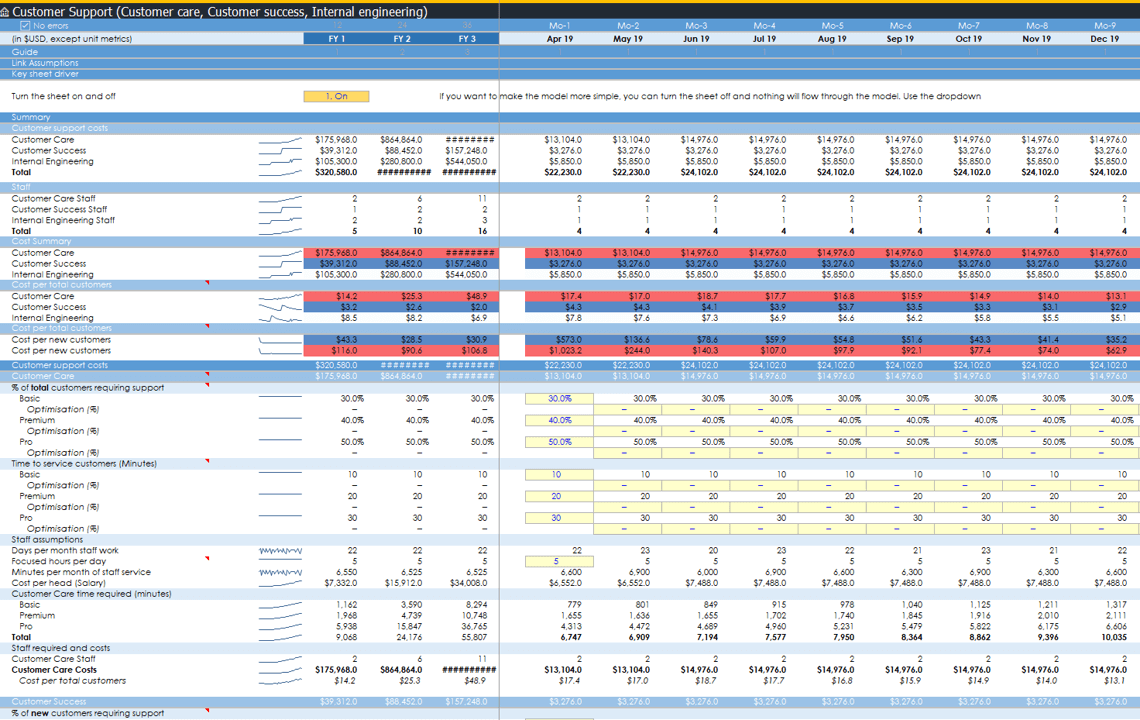
- Integrated with staff sheet: Flows into the staff sheet automatically
- Switch on and off: Turn the sheet on or off with a flick of a switch if this is too detailed for your stage
- All support staff covered: 3 sections for customer support, customer care and internal engineering. Customer support covers your ongoing needs and the other two cover on-boarding of new customers
- Simple but detailed: Defined what % of customers need help and how many minutes they need on average, and the model tells you how many staff you need
Got expansion revenue? 2 ways to do it built in
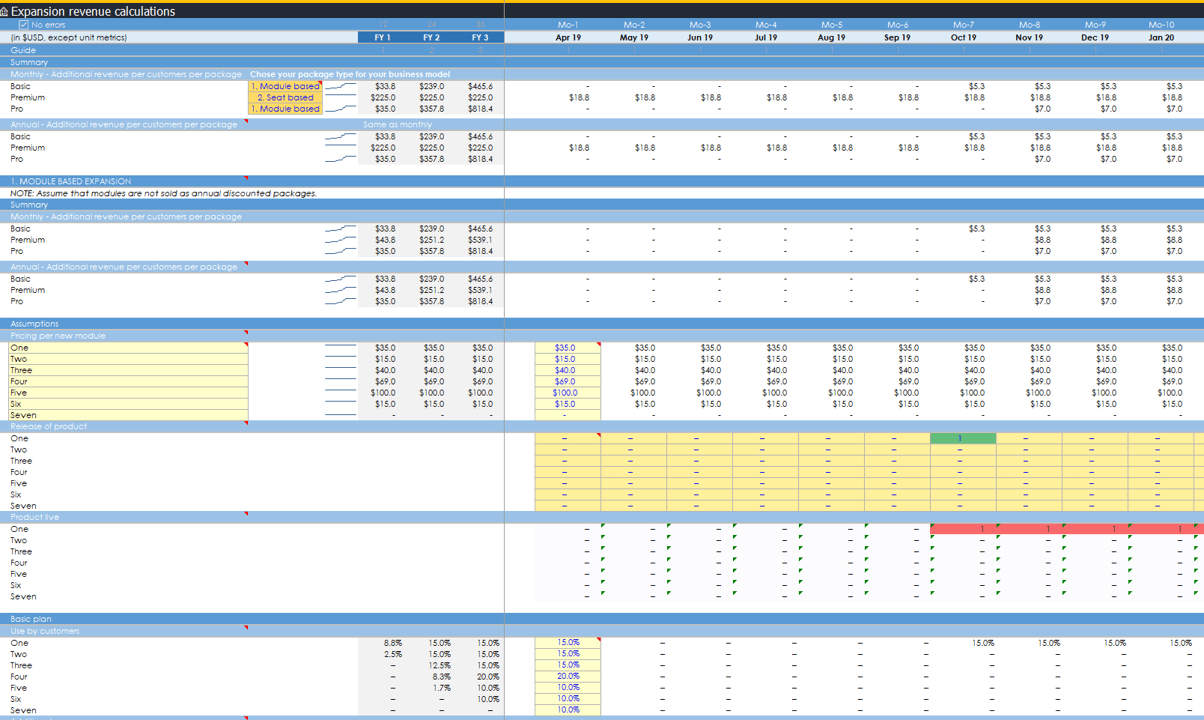
- 2 ways to calculate expansion revenue: Switch between three pre-built expansion revenue based modules. Module based and seat based.
- Modules: Modules are new features you ship customers pay for. Pick when you launch them, what you charge and what % of customers buy them
- Seats: Seats are just more users at a firm. Define how many seats, the price per seat and what % of customers take them
- Integrated: Automatically feeds into other sheets to add to your MRR build
Professional services included
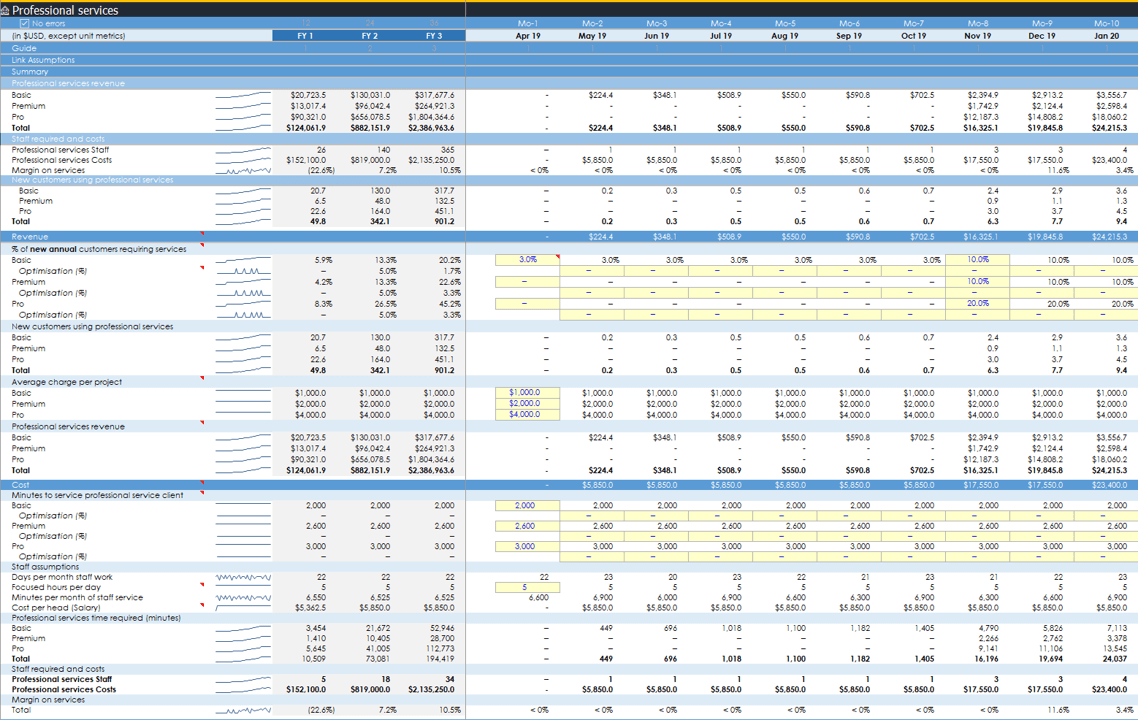
- New revenue and costs: If you offer professional services to new clients, you can add in the revenue you generate and cost cost to service them and it will feed into the sheets they need to be in
3 ways to set your pricing based on your business model
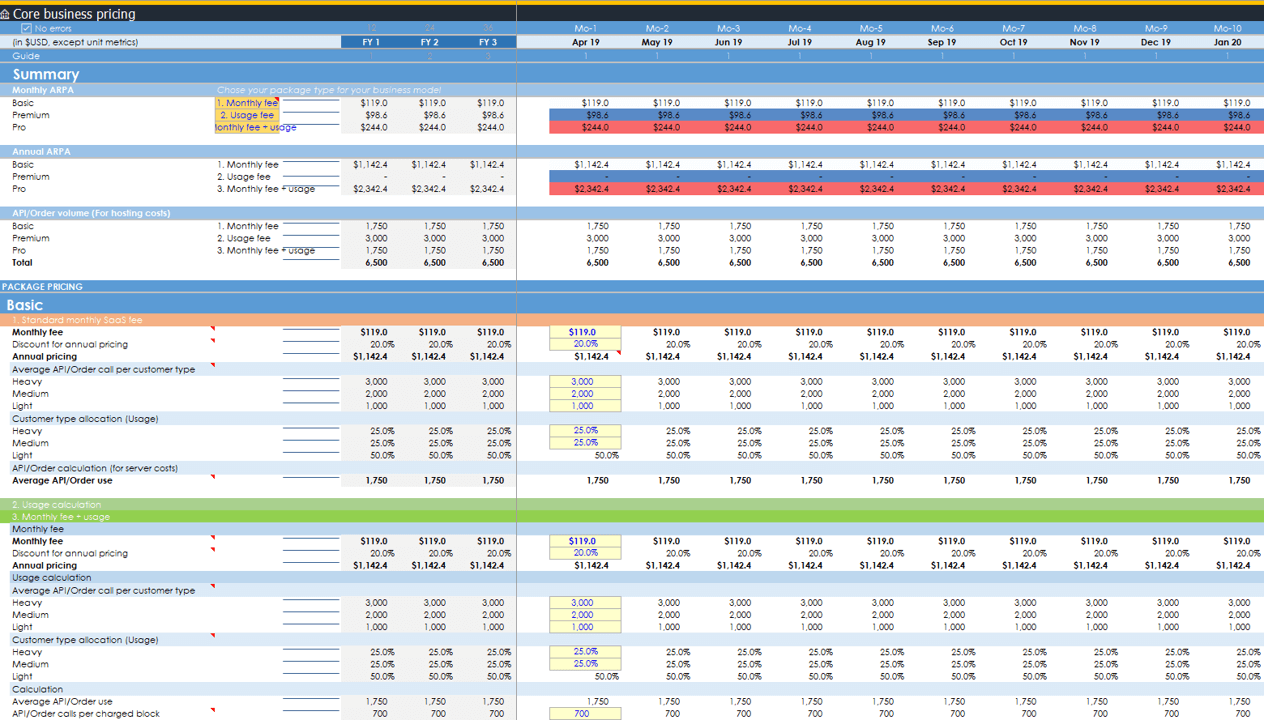
- Switch between 3 pricing models: Charge a monthly fee (normal), usage (such as for API calls) or a combination (monthly fee + usage fee)
- Discounts for annual: If you offer discounts for annual subscriptions you can simply add the discount and the model does the thinking for you
- Usage integrated with tech costs: If you involve a lot of API calls (or change to whatever suits you), the API calls are linked to your tech expenses to make costs easier to calculate
Cohort power
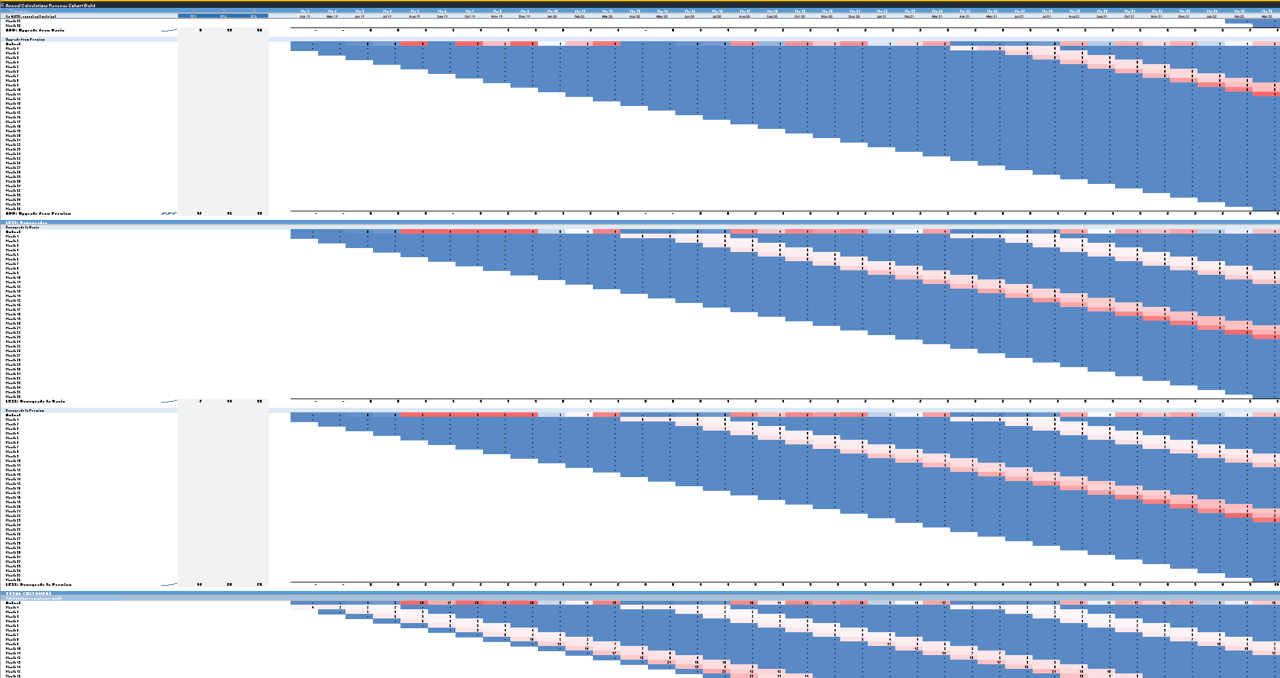
- Granular modelling: The entire model is based on monthly cohorts. This is complicated to build but enables you to do a lot of things you couldn't without them. The annual calculation sheet is 3,482 rows long alone. Yes, I know my stuff
Control over customer and revenue forecasts
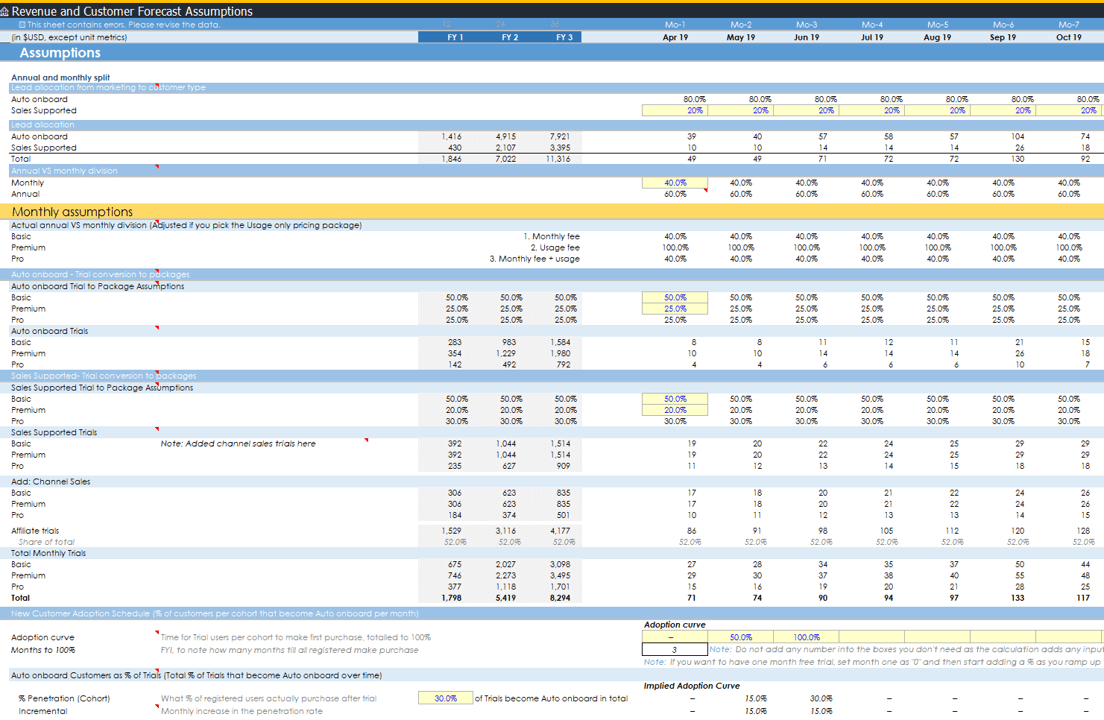
- Annual vs monthly: Define what % of your customers are annual or monthly. Each have their own assumptions. No investor is going to say you haven't thought about your business again
- 3 avatars: Customers have three profiles throughout the model: basic, premium, and pro
- Auto onboard vs sales supported: If you have a low ARPA you are going to have customers on board themselves. Alternatively you need a sales team? Define how large a sales team you need by allocating customers to them here
- Funnel: Traffic to trial to customer. We define how trials convert into customers and over what time period
- Adoption curve: Define how long it takes for trial customers to become customers
Complete marketing
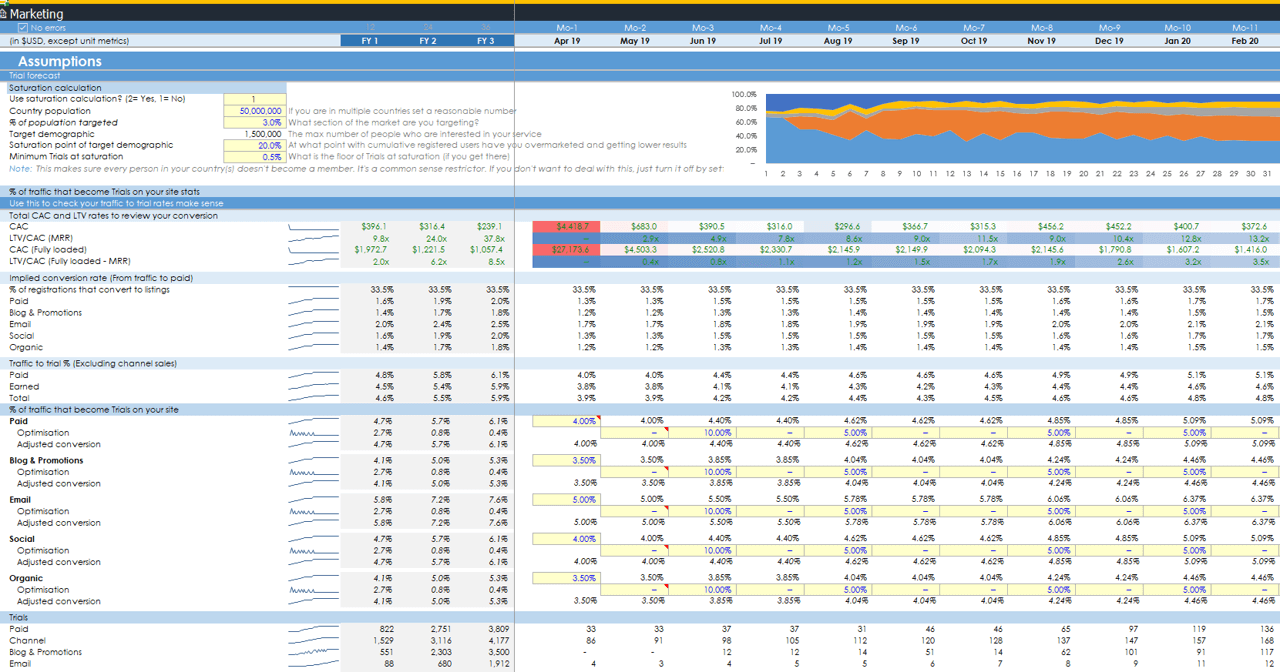
- Granular assumptions: Control how traffic turns into registrations by setting conversion rates
- Conversion: Convert your traffic to registration
- 5 marketing sheets: Main marketing sheet gets fed by 4 marketing activity sheets which are all integrated. Paid, organic, email, blogging, social, and channel sales
- Growing too large?: Inbuilt calculations to stop you from growing larger than your defined market. Turn it on and off... if you want that level of nerdy- ignore and hide it otherwise!
Paid and organic marketing
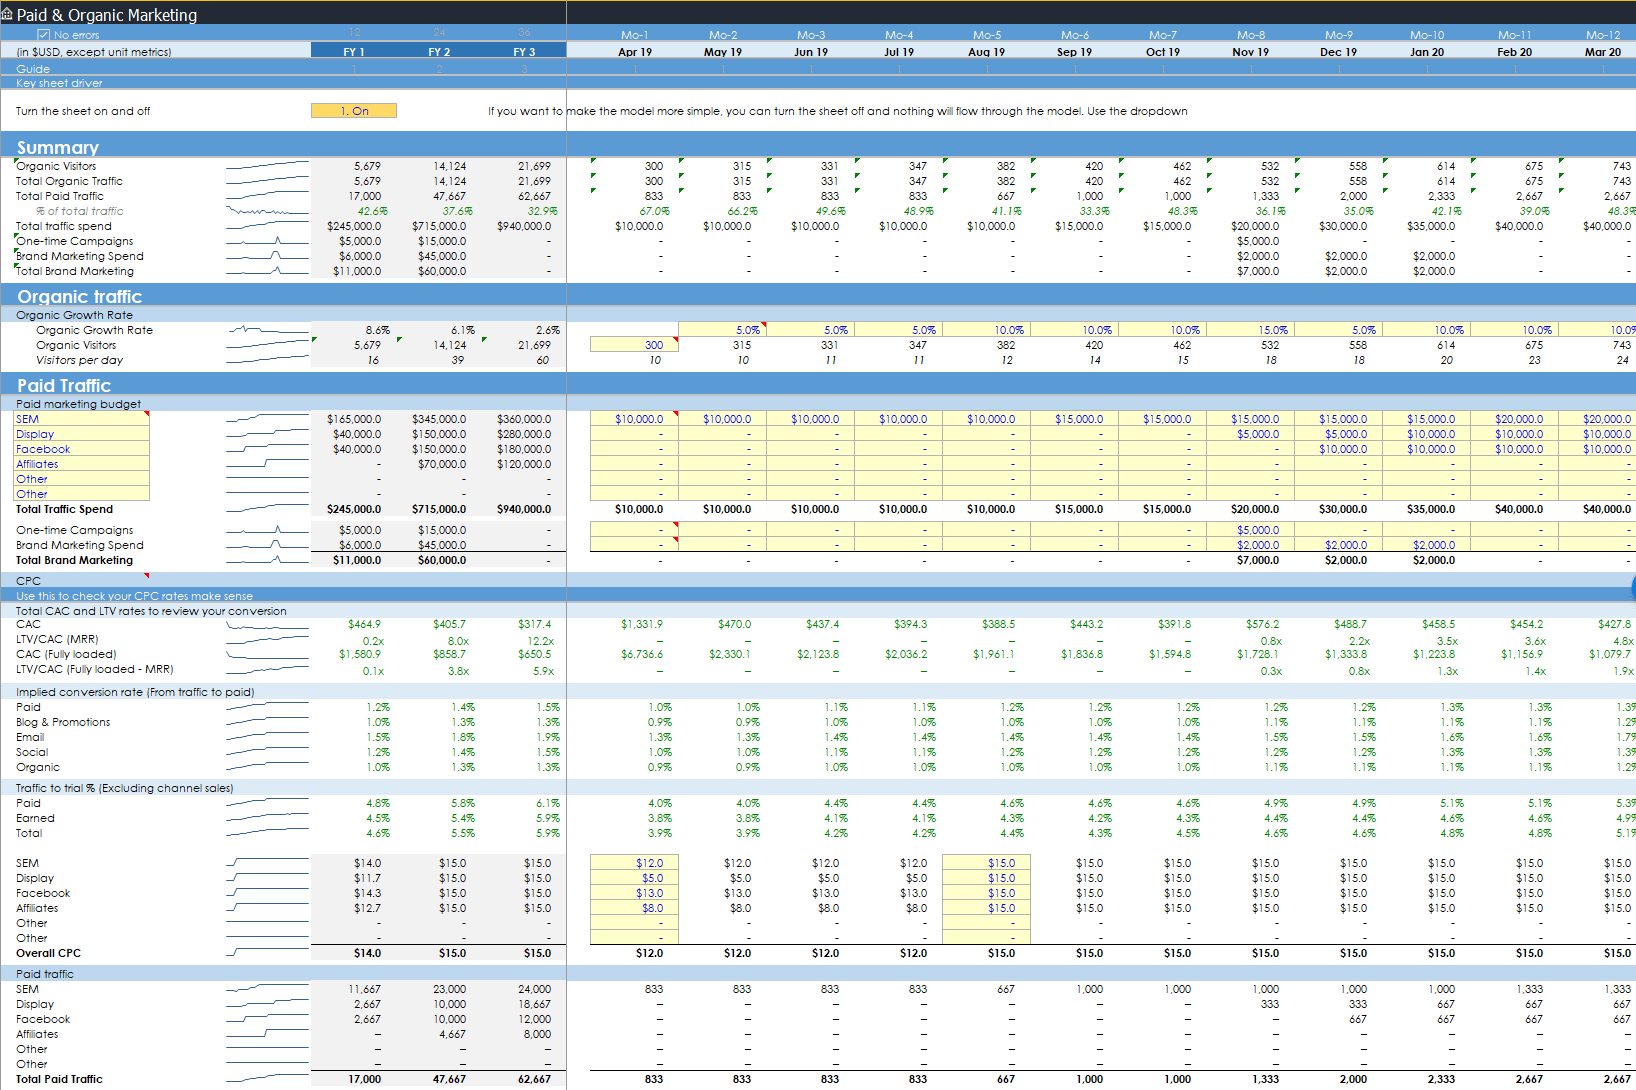
- Organic growth: Simply add an organic growth rate of people going to your site
- Paid growth engine: Set your spend per month across up to 6 channels. Set your CPCs to generate traffic to your site. In addition you can add non-paid spend which doesn't attribute traffic (one-time campaigns and brand marketing) but will still contribute to your marketing costs and metrics
- Supporting metrics: See supporting conversion rates and metrics to check things make sense
Email marketing
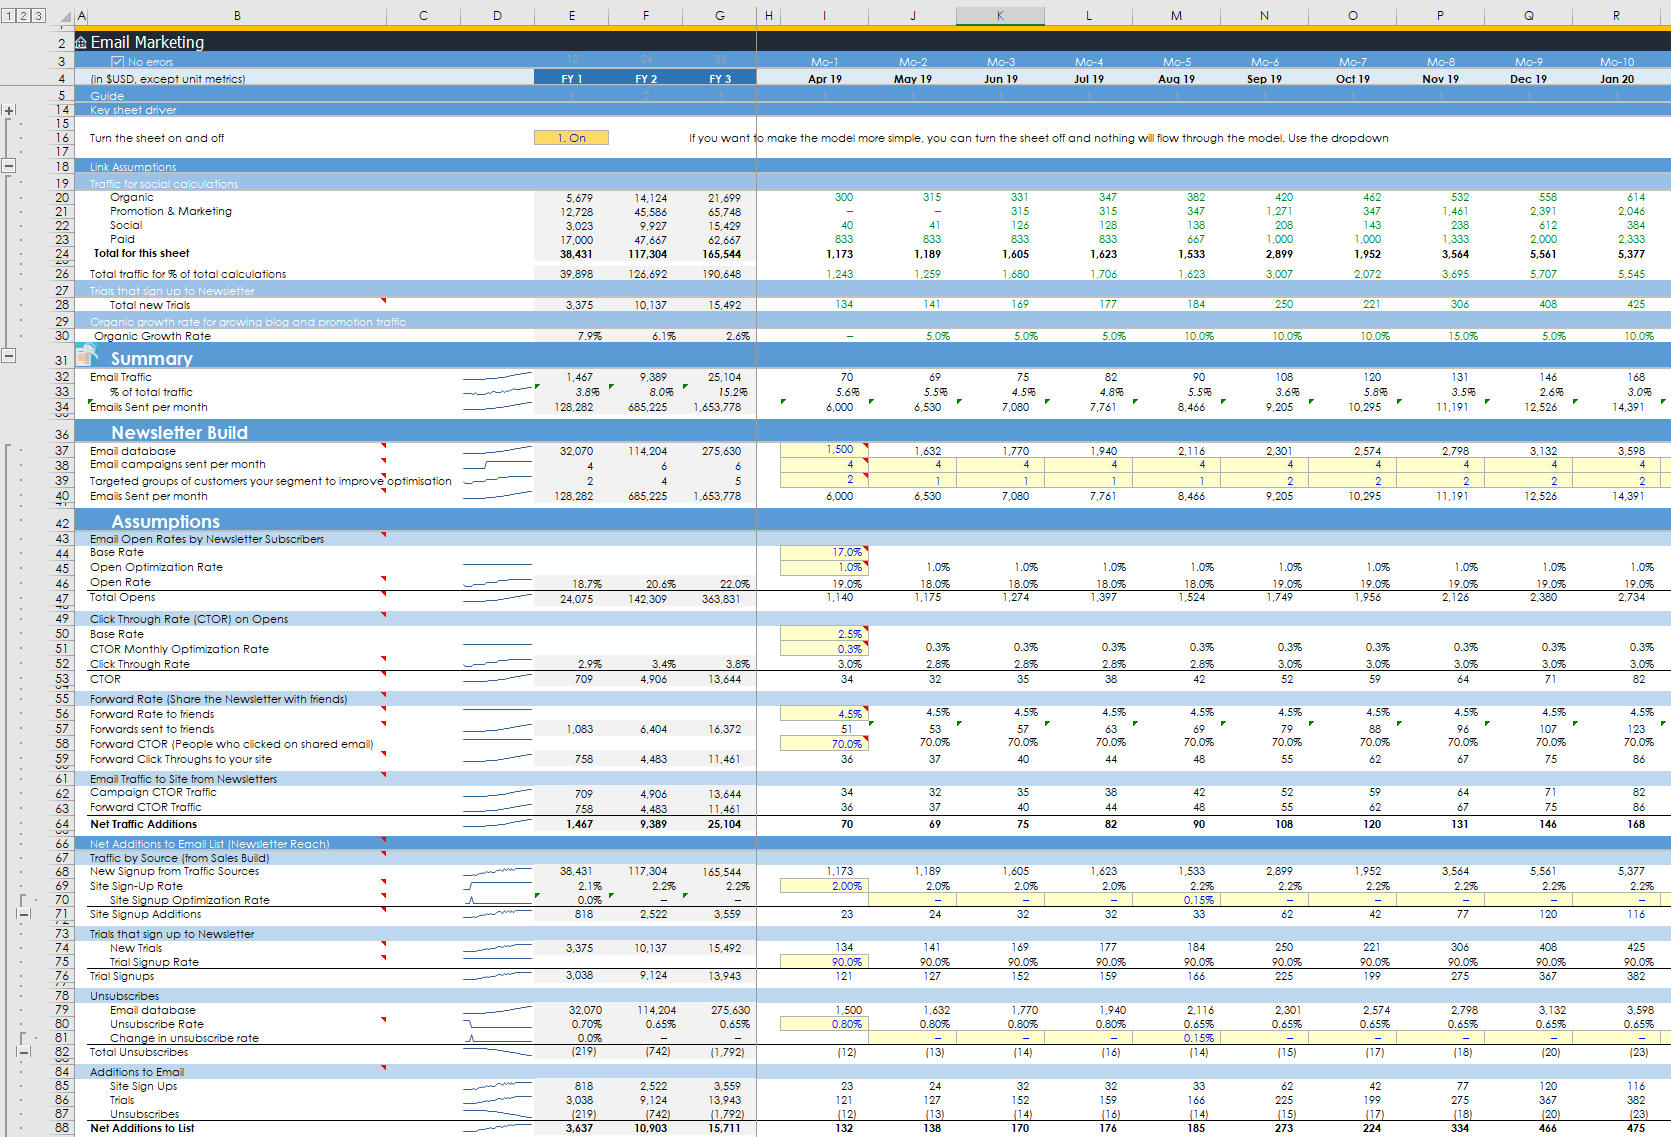
- Earned growth: Support sheets effectively help you to reduce your paid CAC
- Fancy assumptions: There's a load of assumptions built-in from open rates, click through, forward rates, rebroadcasts, unsubscribes, etc.
Blog & Social
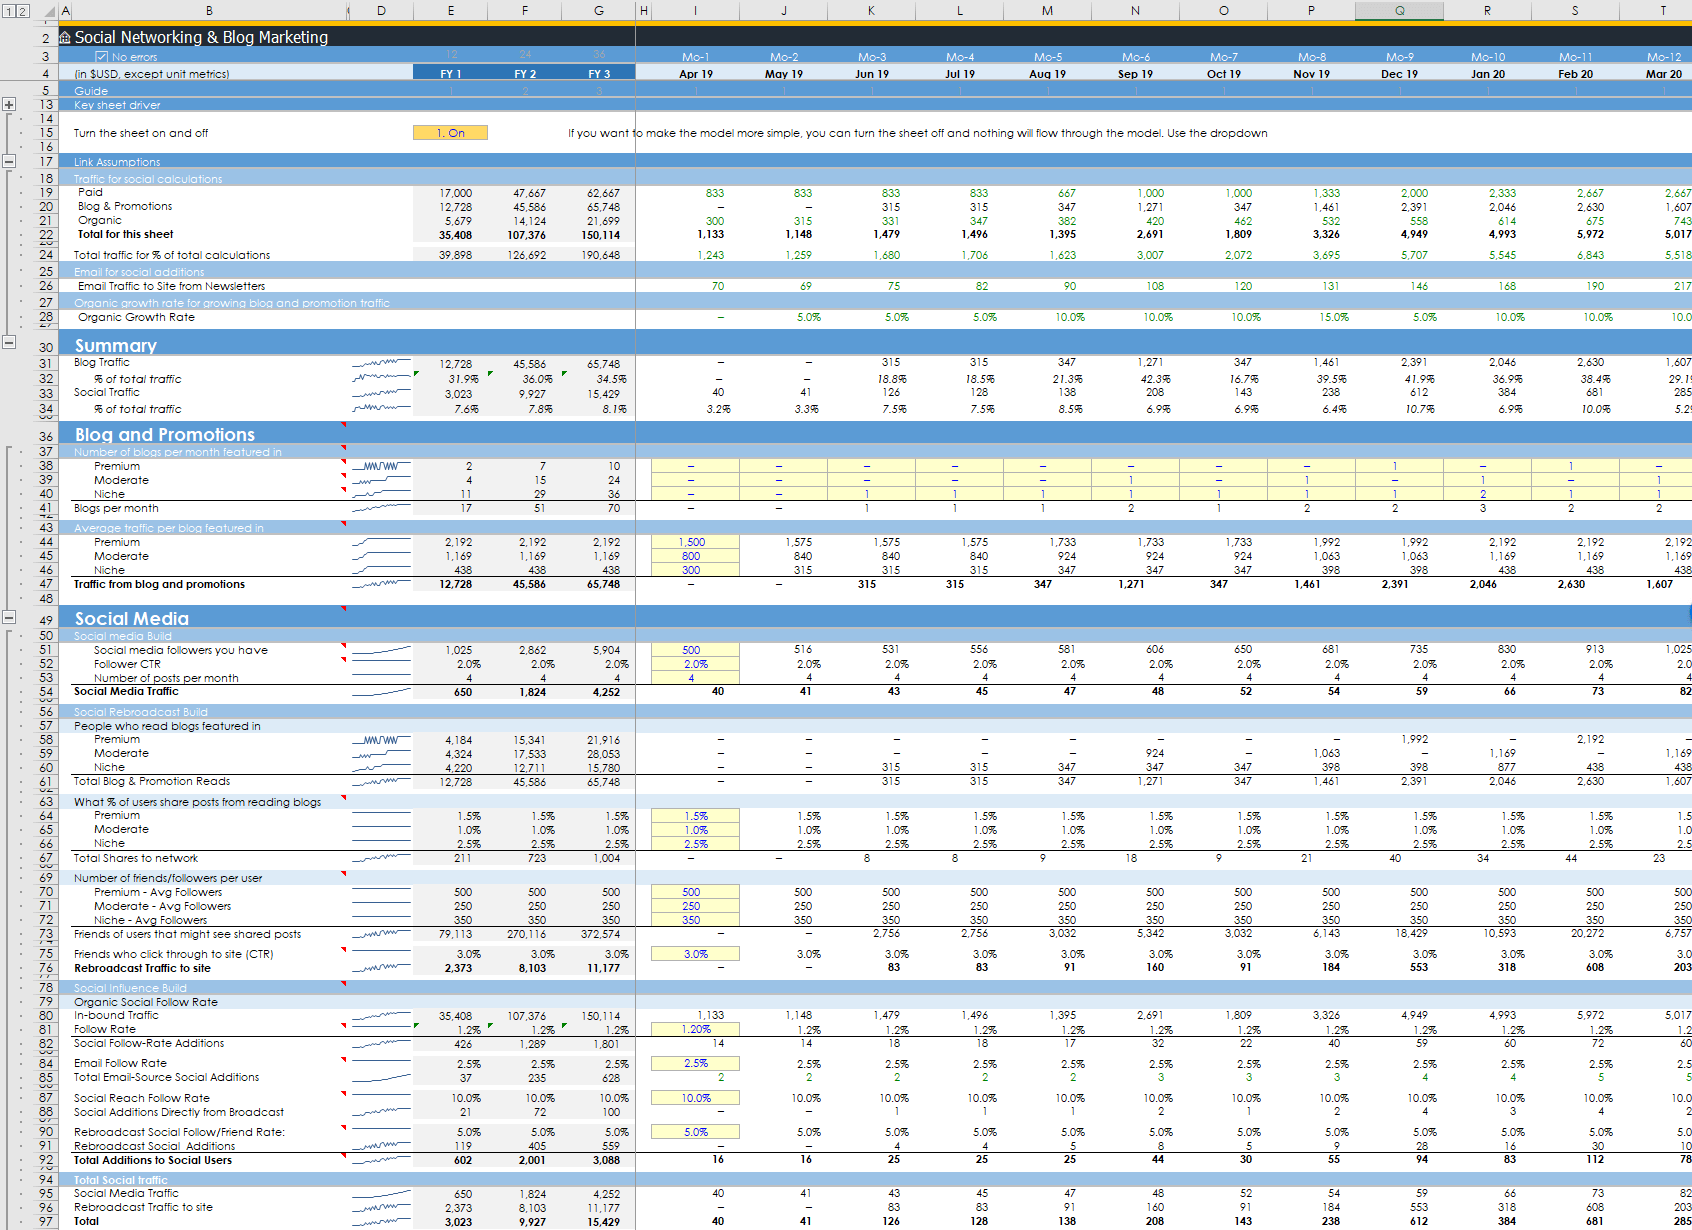
- Earned growth: Support sheets effectively help you to reduce your paid CAC
- PR: Get press, featured in TechCrunch etc and get earned traffic to your site. Simple to follow and understand.
- Social: Build a social following with lots of detailed assumptions as the email sheet. How many times you post, follow CTR, follower shares, rebroadcast rate and CTR, as well as builds to your email list
Channel sales as well
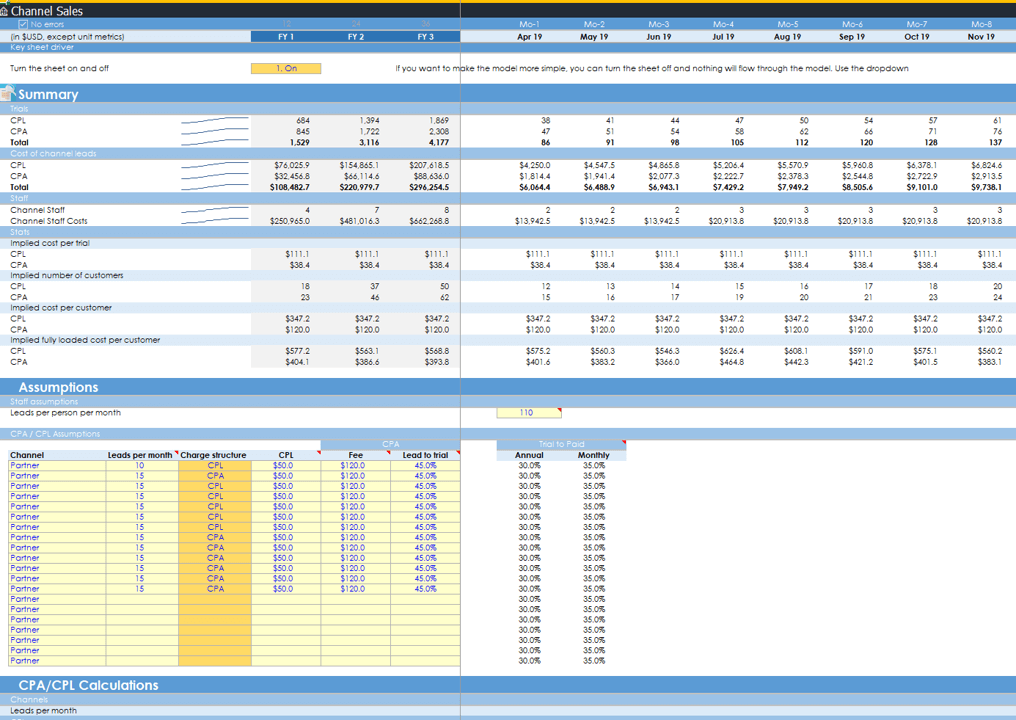
- Channel sales: Add a new acquisition channel, or turn it off with the flick of a switch
- CPA and CPM: Pay your channel partners on a CPA or CPL basis
- Staff included: Channel sales staff are automatically calculated based on how many leads a month they can handle