Tl;dr: Free SAFE calculator in Excel to calculate the post-money and pre-money SAFE from Y-Combinator. It’s the only one on the internet.
Y-Combinator released the new post-money SAFE in October 2018. It’s a large change to the original pre-money SAFE that was released in 2013.
There is no calculator in Excel to actually illustrate the mechanics for the new SAFE so I made it. You can now use this calculator to see how dilutive raising SAFEs will be dependent on your series-A.
It was a nightmare to make. The docs are not that instructive:
- How ESOP calculations are not explained or even addressed. They just state the number
- What is new money and what comes from pro-rata is not clear
- There is no reference to rounding conventions (I found they likely are using 4 decimal places on pricing calculations)
- You have to reach page 22 in an example to realize there is something worse than a full ratchet built in
- There are a few minor mistakes
The new Post-Money SAFE is a 180 degree on being founder friendly. The original docs were so founder friendly no smart investor would sign them. The new ones are so investor friendly that a founder would be an idiot to use them!
I’ve written a blog comparing SAFE notes to convertible notes. You can check it out here: Differences between SAFE and convertible notes.
Regardless, Y-Combinator is an enormous institution now and some people are going to use the post-SAFEs due to their marketing power (Case can be made that Y-Com are acting more like investors now and so the new docs align with their economic incentives). For those that want to understand what these structures are going to do to their cap table, I spent 5 days making a resource for founders and investors to be able to understand how the calculations work so no one else had to go through the pain too.
It’s my hope this helps a lot of people.
Note. I have written line by line explanations of all the Y-combinator documents that you can find here. If you want the plain English version, you can check them out here:
- Safe: Valuation Cap, no Discount
- Safe: Discount, no Valuation Cap
- Safe: Valuation Cap and Discount
- Safe: MFN, no Valuation Cap, no Discount
- Pro Rata Side Letter
I’m going to walk you through how the Post and Pre SAFE work with examples. The examples are going to be based on the actual inputs used in their guide. You can get the guide here, but I’m going to bundle it with the model so you can have it to hand.
There are two main examples, one key variation, and two exit scenarios. These are, at a high level:
- Example 1: There are two post SAFE notes.
- Base 1: This is the main example Y-Com takes you through. There is a $5m raise on a $15m pre.
- Base 2: This is a variation. You raise $2.2m on an $8.8m pre ($11m post)
- Acquisition scenario 1: What happens if you are acquired for $10m before the equity financing?
- Acquisition scenario 2: What happens if you are acquired for $3m before the equity financing?
- Example 2: There is one Post SAFE and one Pre SAFE note. There is a $5m raise on a $15m pre.
- Base 1: This is the main example Y-Com takes you through
- Base 2: This is a variation. You raise $2.2m on an $8.8m pre ($11m post)
- Acquisition scenario 1: What happens if you are acquired for $10m before the equity financing?
- Acquisition scenario 2: What happens if you are acquired for $3m before the equity financing?
Download the SAFE calculator
The file is zip, so you need to extract it. It has the excel and the Y-Combinator Post SAFE guide. Input your email and it will be sent to you. Press download in the email and it will open in your browser/save to your download folder.


Video on YouTube
If you want to watch the video version of ”SAFE Calculator for the Y-Combinator Post Money SAFE” You can watch below:

Founder ownership
Before we go through the examples, I made a cool little sensitivity table for you. In it, you can input your SAFE notes and you can see how much you will own depending on the pre-money valuation and amount of money that you raise. It looks like this:
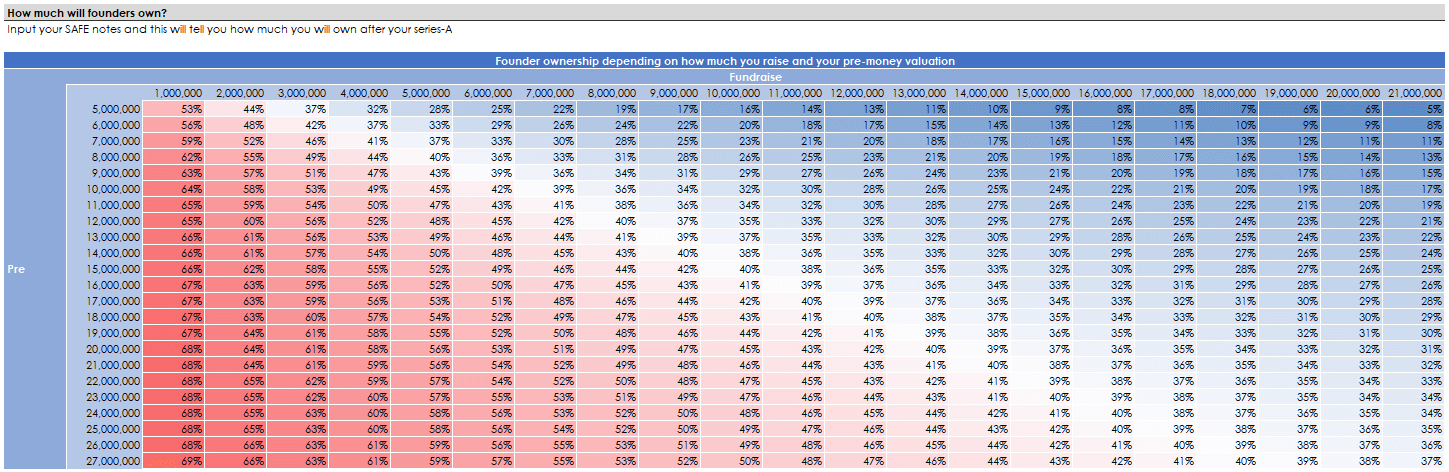
The obvious takeaway is that the higher your pre-money, the more money you can raise without a lot of dilution. You probably know approximately what your valuation is going to be and how much you are raising. This will give you a range for the dilution you should expect and your ownership post the round.
Let’s get into the examples now for the SAFE calculator.
Example 1: Base 1
If you open the model up (download it) head to the tab “SAFE – 2 Post Notes”. Hit the first button “Set to base settings” to make sure the numbers are right.
Assumptions
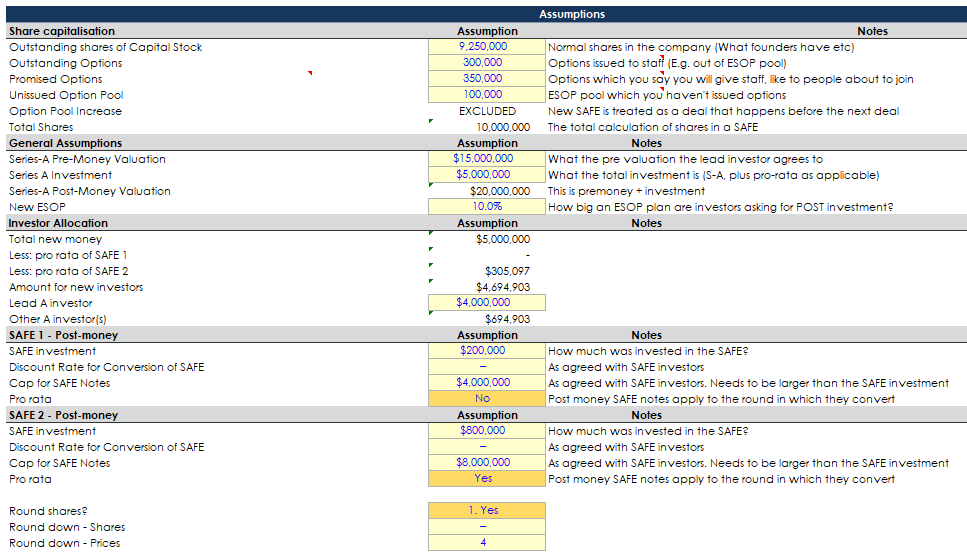
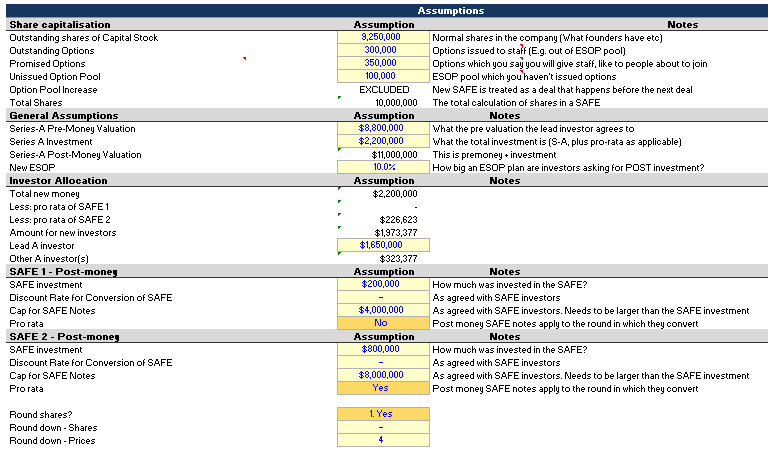
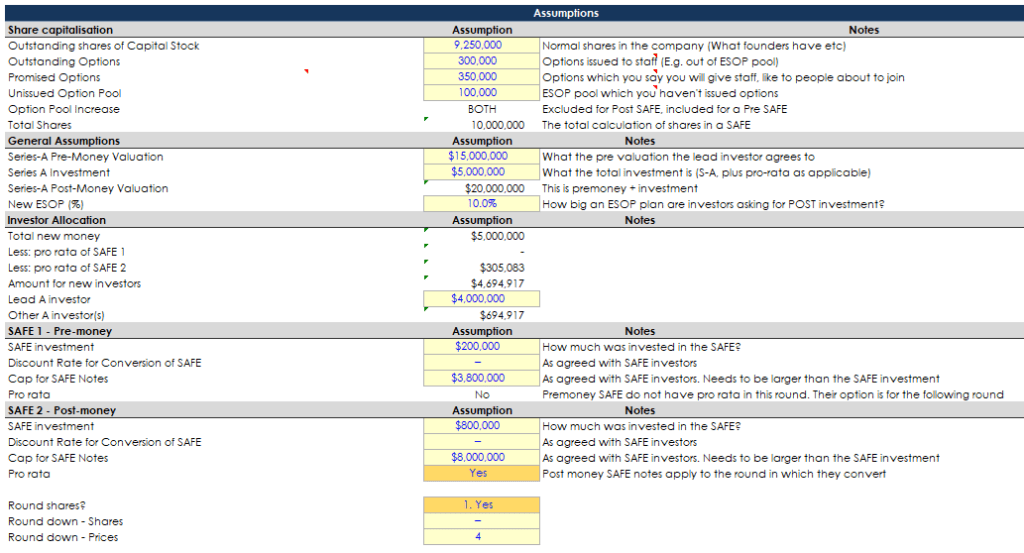
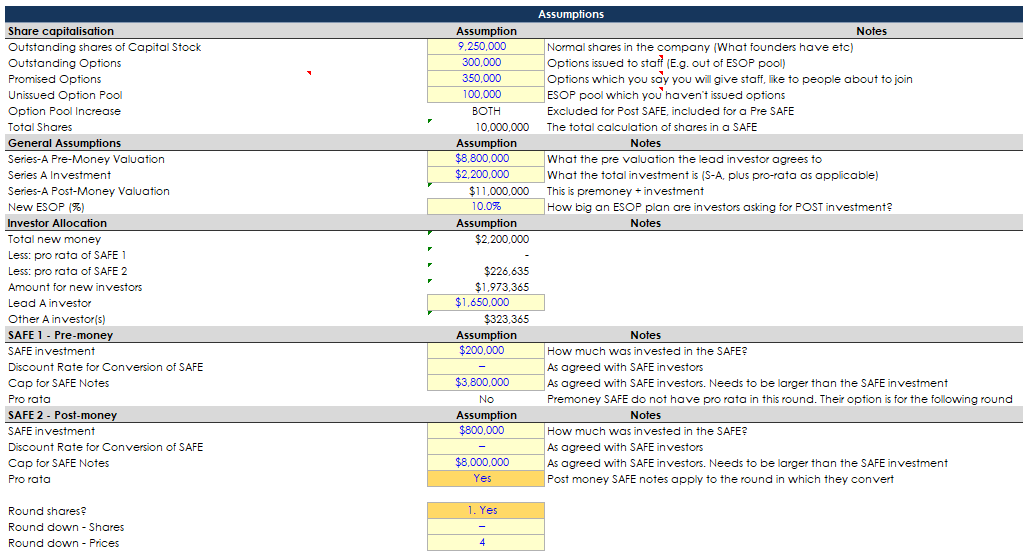
The inputs are all in yellow.
In this example there is only a cap, there is no discount.
Shares
In total, there are 10m shares. These are broken up into:
- 9,250,000 outstanding stock
- 300,000 options
- 350,000 promised options
- 100,000 unissued options
There is no optional pool increase.
Series A investment
- The total investment is $5m (They don’t make it clear, but it’s not all from new investors)
- The pre-money is $15m
- A new ESOP is made of 10% post the S-A investment. We deduct the unissued shares since there are already unused shares
- The new lead investor is investing $4m. This is the money from new investors
- If we deduct the pro-rata from SAFE 2, there is $694,903 of new money from another new investor
SAFE 1
- This is a post-money SAFE
- They invest $200k at a $4m cap
- There is no pro-rata
SAFE 2
- This is a post-money SAFE
- They invest $800k at a $8m cap
- There is a pro-rata
Rounding in the SAFE calculator
We round down the prices to 4 decimal places
Pricing and share calculations
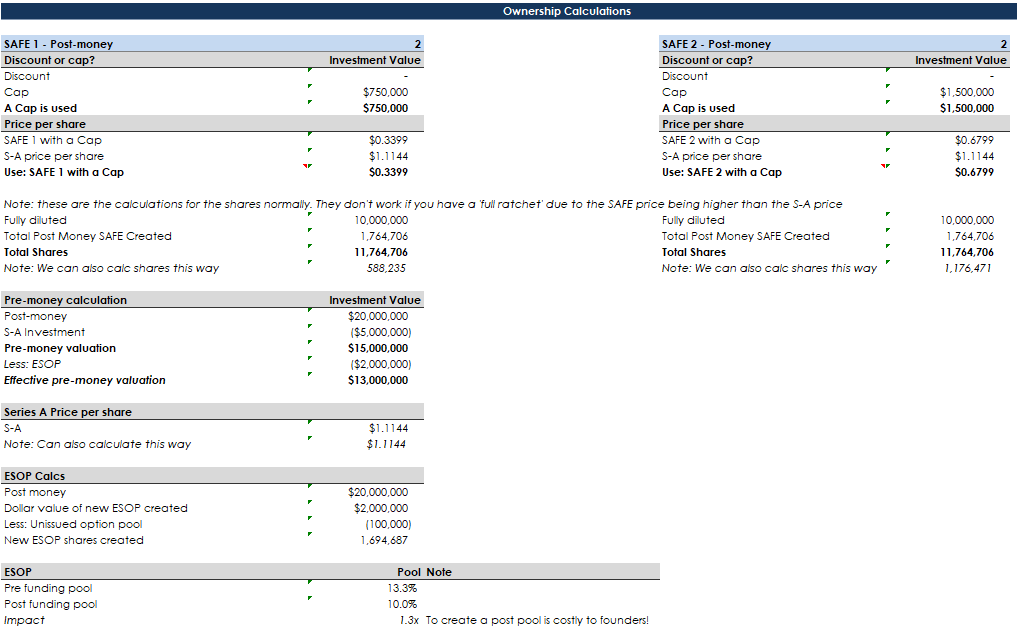
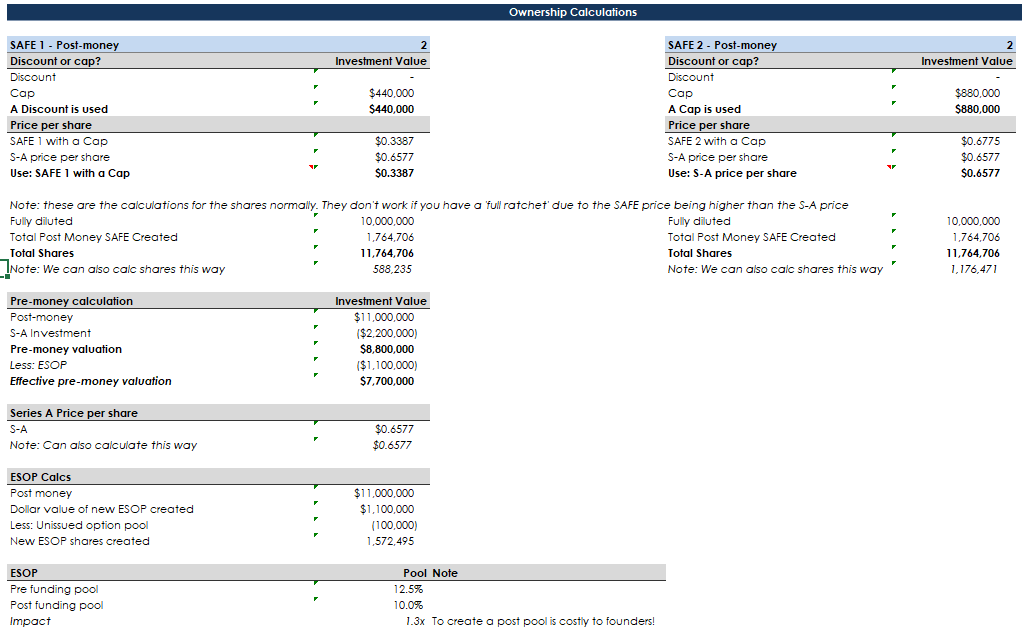
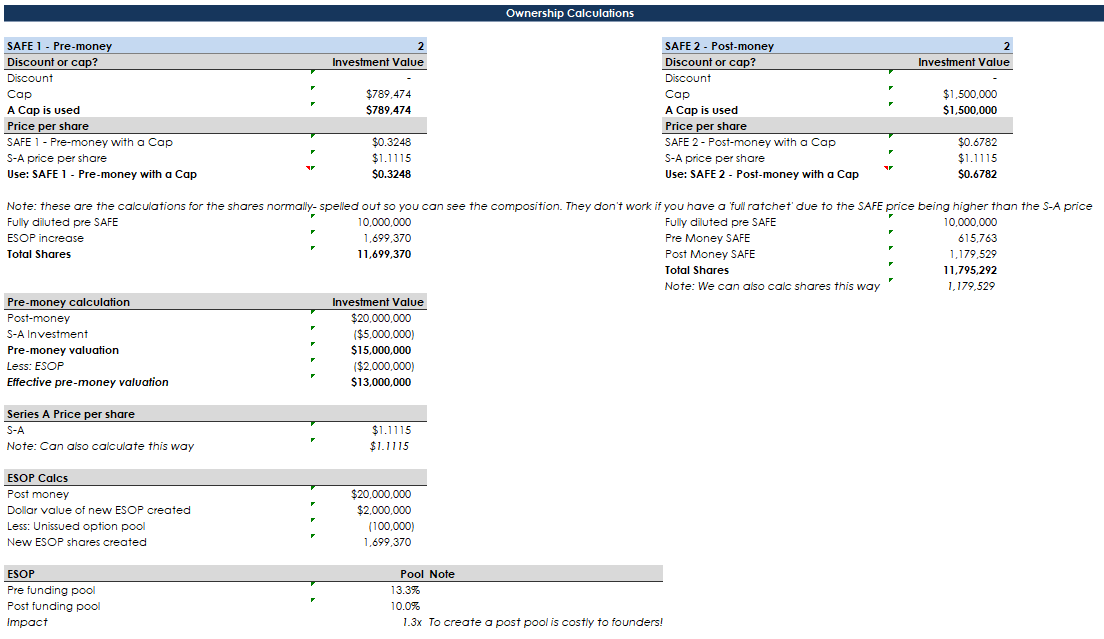
Here we can see the calculations for post the SAFE notes. Next, there are the S-A and ESOP calculations.
Prices per share:
- SAFE 1 is $0.3400
- SAFE 2 is $0.7800
- S-A is $1.1144
1,694,687 new ESOP shares are made to ensure there is a 10% ESOP post the round.
Learnings in the SAFE calculator
Cap vs discount
You can have a SAFE note with/without a cap and a discount. There is a little switch which says “A Cap is used”. If you don’t have a cap, then it will always be a discount and vice versa.
Switch between prices
We will talk about the full ratchet. To decide which price to use you can see the row which says “Use: SAFE 1 with a Cap”. That’s a little switch which takes the smallest number.
Share calculations
I’ve spelled out how the shares in the denominator are calculated. You will note that it is different in example two with the pre and post note. When there are two post notes the share denominator will be the same.
I’ve included a note to teach you how the number of shares for the SAFE can be alternatively calculated. With convertible math, there are a few ways to get the same results, if you know how to do the math. It’s a lot to do with what you add/deduct to the numerator and denominator. In this example, you divide the investment over the cap and times by the total shares to get the answer.
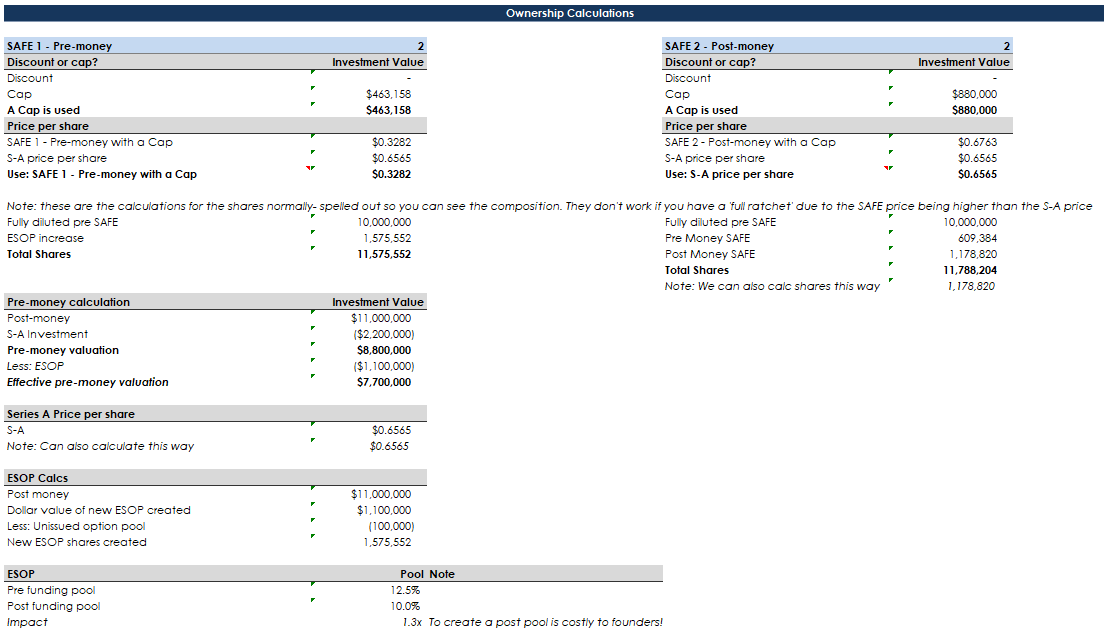
Pre-money calculation
These inform you on the pre and post money. The reason I spelled them out again is I want to deduct the ESOP from the pre money. By doing this we can see what the effective pre-money valuation is. Adding an ESOP pool is one way to decrease the pre money valuation. It’s a trick investors apply.
I then show you in the series-a price per share section another way to calculate the price per share by using the effective pre-money valuation.
ESOP calcs
I have a little section to calculate the dollar value of the new ESOP created and the number of new shares that get created.
The method I use is not very common. The reason I use it is that it prevents an iterative calculation being created which 1/ slows models down and 2/ makes them unstable.
The way we calculate the ESOP is by multiplying the desired ESOP % against the post-money valuation. This gives you a dollar value. You can deduct that from the pre-money valuation to tell you the effective pre (as above) and use it to calculate the s-A price per share.
To calculate the number of ESOP shares, we divide the dollar value of the ESOP by the S-A price per share.
Note that you need to deduct the unissued option pool, otherwise you are making a pool larger than you need. Investors just want 1,794,687 shares. So if you already have 100k unused, you deduct the 100k and now you have to create 1,694,687 shares instead.
The alternative way (And probably common) to calculate the ESOP is to go to the last cap table and multiply the total number of shares by the ESOP % (e.g. 10%) and then the new total with iteratively calculate how many shares need to be created. It works, but it isn’t the best way.
Round calculations
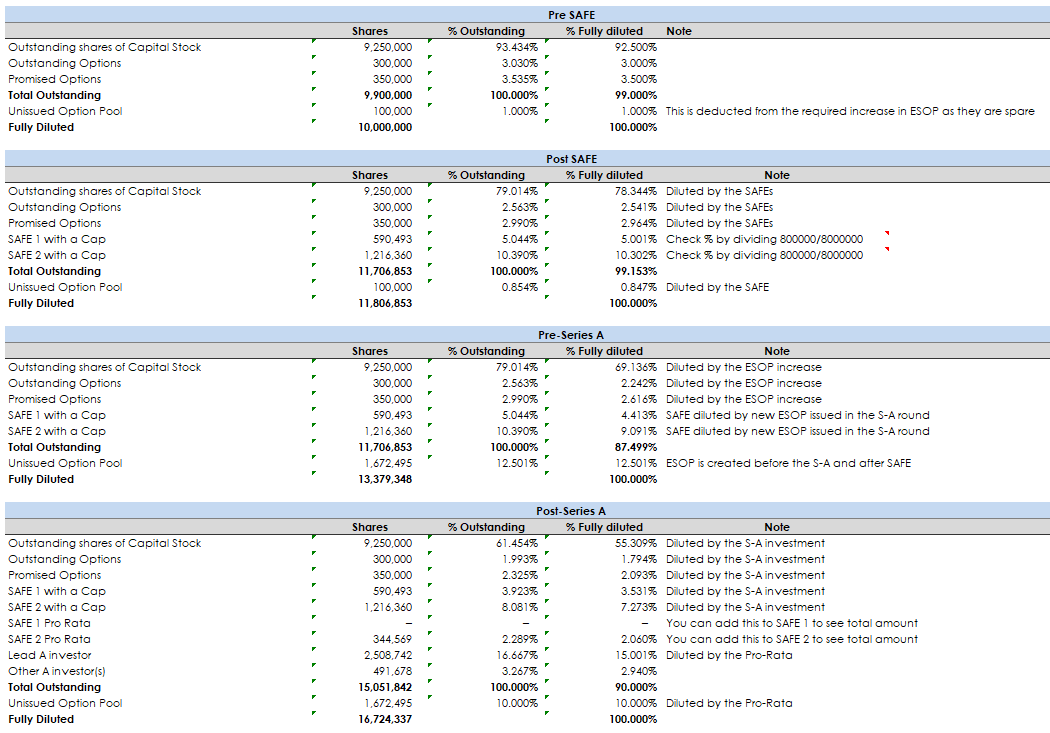
Now we have a series of calculations to spell out how rounds are calculated.
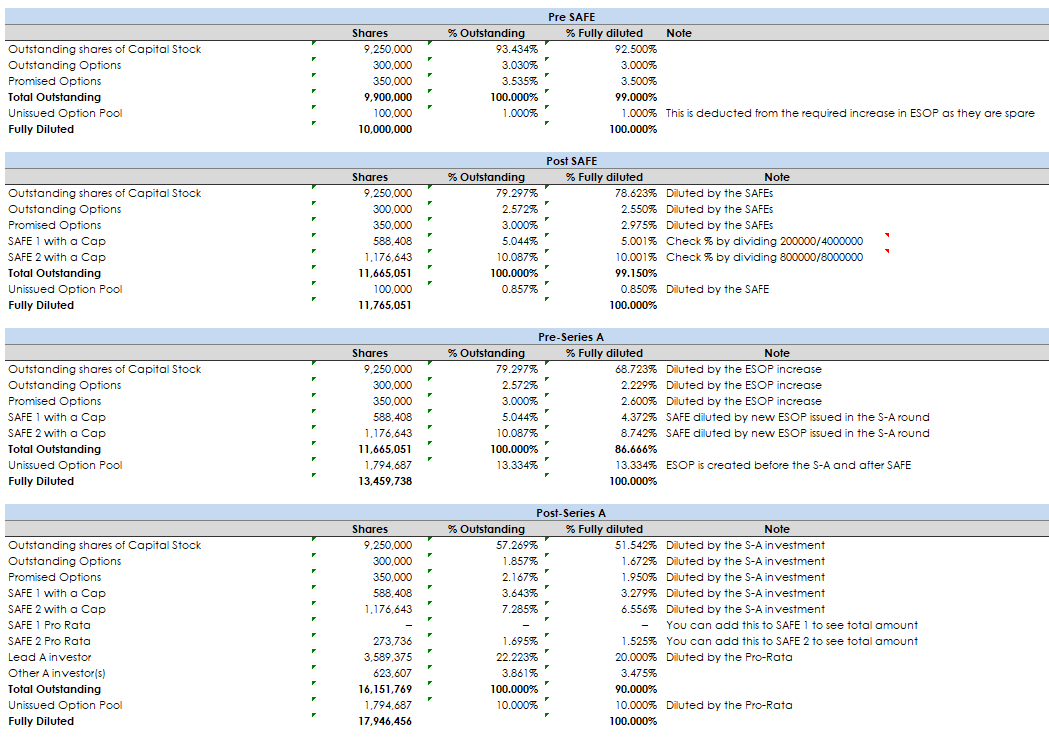
Pre-SAFE: The first is what your cap table looks like with no funding.
Post-SAFE: Now both the SAFEs hit the cap table. Founders have been diluted from 92% to 78%. The SAFE holders have 15%.
Pre-Series A: The increased ESOP hits the cap table. Founders are diluted to 68%. SAFE holders are also diluted a bit, now owning 13.1%.
Post-Series A: The S-A investors are now on the cap table. Founders have 51%. The ESOP is 10%. SAFE own 11.359% in aggregate. Note here, the SAFE 2 have a pro-rata right. This brings their aggregate ownership to 8.081%. So in total SAFE own 11.359%. The series-A new investors own 17.94%.
You can see how the SAFE calculator matches up with the guide on page 19.
Learnings in the SAFE calculator
% issued to SAFE
For post money SAFEs you can calculate the % they should have by dividing say 800k/8m and see that is 10%, or 200k/4m and see that is 5%.
This doesn’t work when there is a full ratchet though as the numbers will be a little higher.
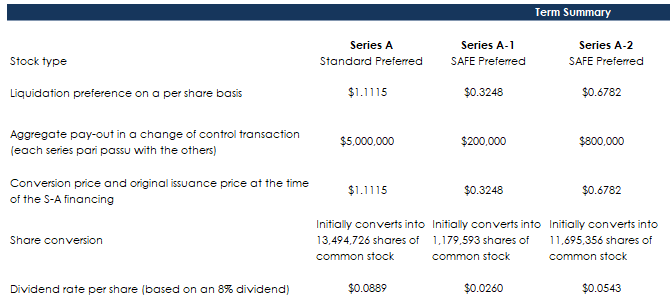
Summary of terms
Here we have a summary of terms as you can see on page 20.

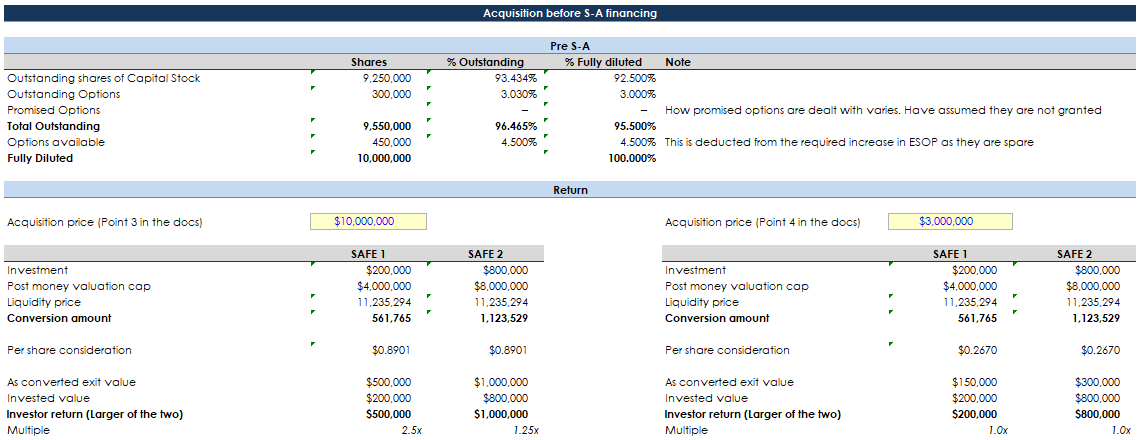
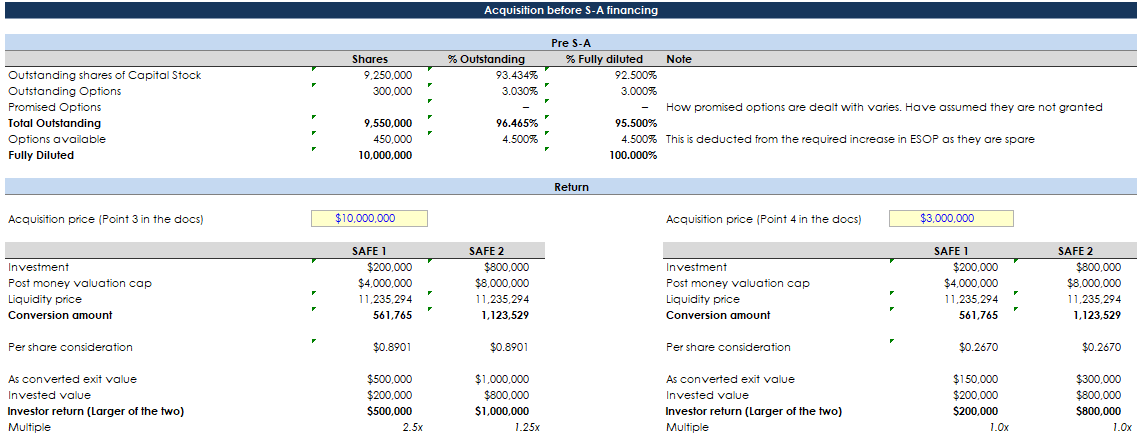
Acquisition outcomes
On page 20 and 21 there are two examples of what happens to the SAFEs if the company is acquired before the series-a.
Example one you are acquired for $10m
In this case, the SAFE 1 can convert to one of the 2 options:
- As converted exit value: This is $500k
- Invested value: This is $200k
The investor converts into $500k and takes a 2.5x return on their investment.
In this case, the SAFE 2 can convert to one of the 2 options:
- As converted exit value: This is $1m
- Invested value: This is $800k
The investor converts into $1m and takes a 1.25x return on their investment.
Example two you are acquired for $3m
In this case, the SAFE 1 can convert to one of the 2 options:
- As converted exit value: This is $150k
- Invested value: This is $200k
The investor converts into $200k and gets their money back.
In this case, the SAFE 2 can convert to one of the 2 options:
- As converted exit value: This is $300k
- Invested value: This is $800k
The investor converts into $800k and gets their money back.
Sensitivity tables for the SAFE calculator
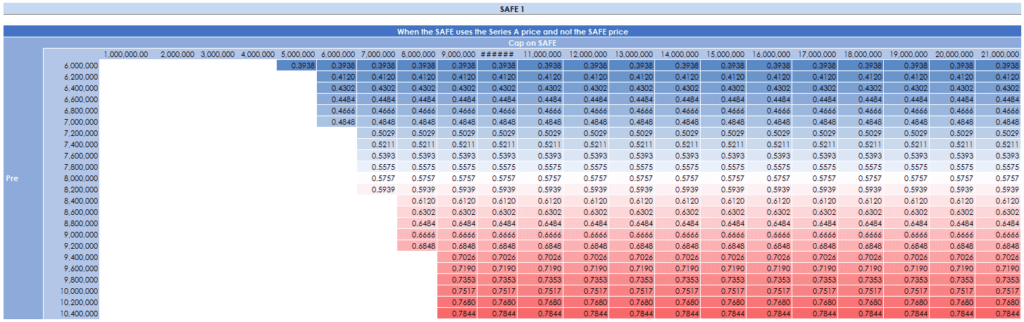
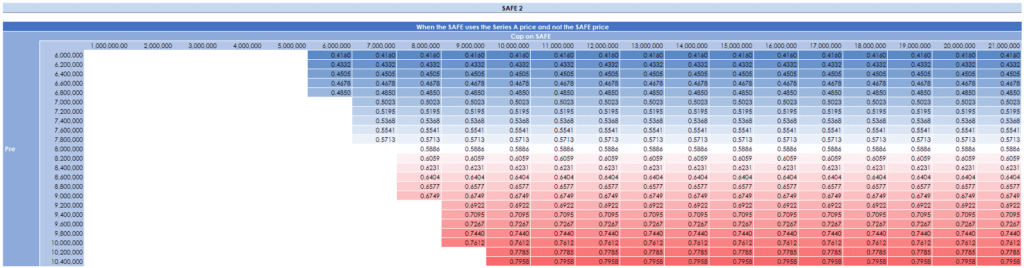
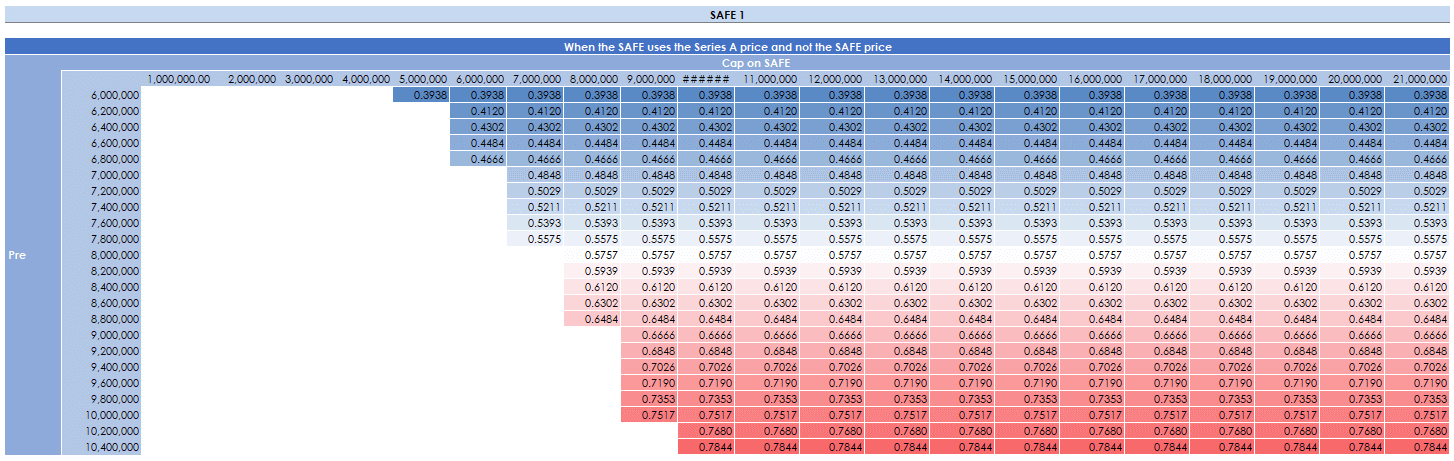
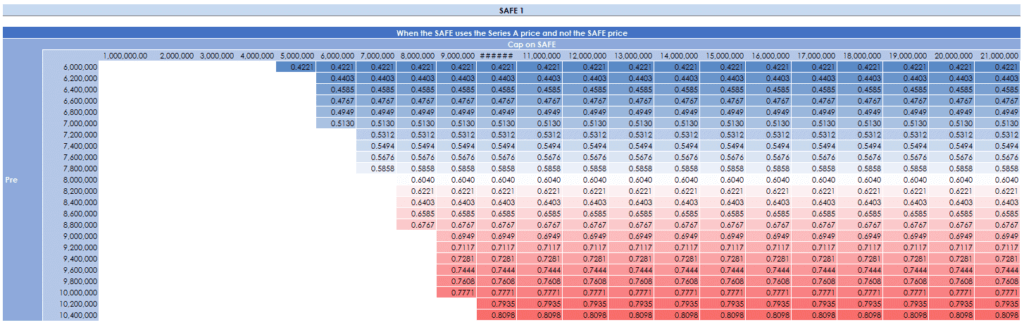
Full ratchet tables
In the SAFE note is something similar, but worse to a full ratchet. A full ratchet is an anti-dilution provision in which the lowest sale price is applied. This means that in the event of a down-round, investors maintain their ownership percentage by being giving more shares (due to a lower price) and the founders get diluted to kingdom come.
In the example of the SAFE, if the pre-money is low enough, you will see that the series-a price is lower than the price at which the SAFE would convert. The post SAFE allows SAFE holders to pay the lowest price and so get the same price as the S-A investors.
In fact, the SAFE is worse than a full ratchet. In a priced round, anti-dilution would only trigger if the valuation is lower than the price. SAFE get fully protected from convertible dilution when the valuation cap is higher.
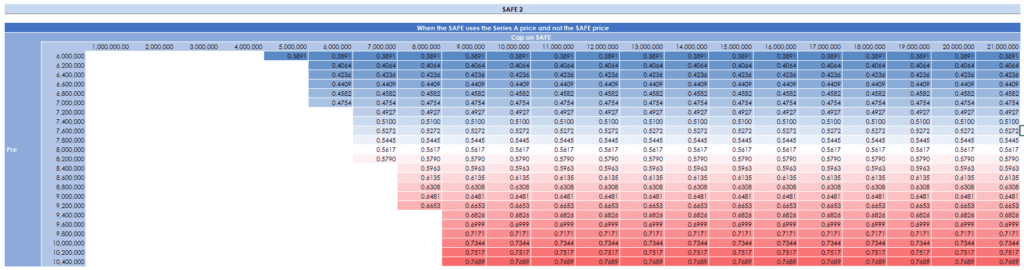
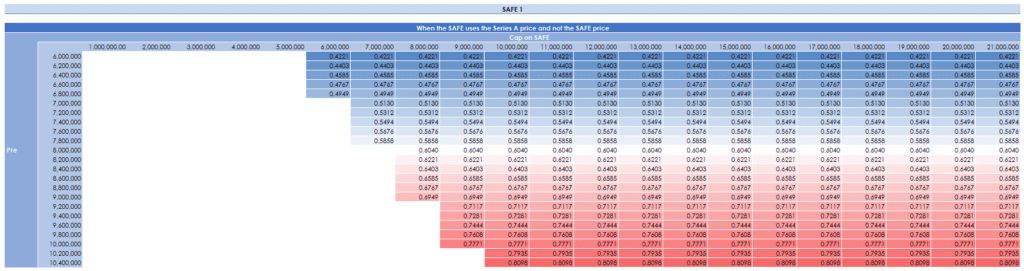
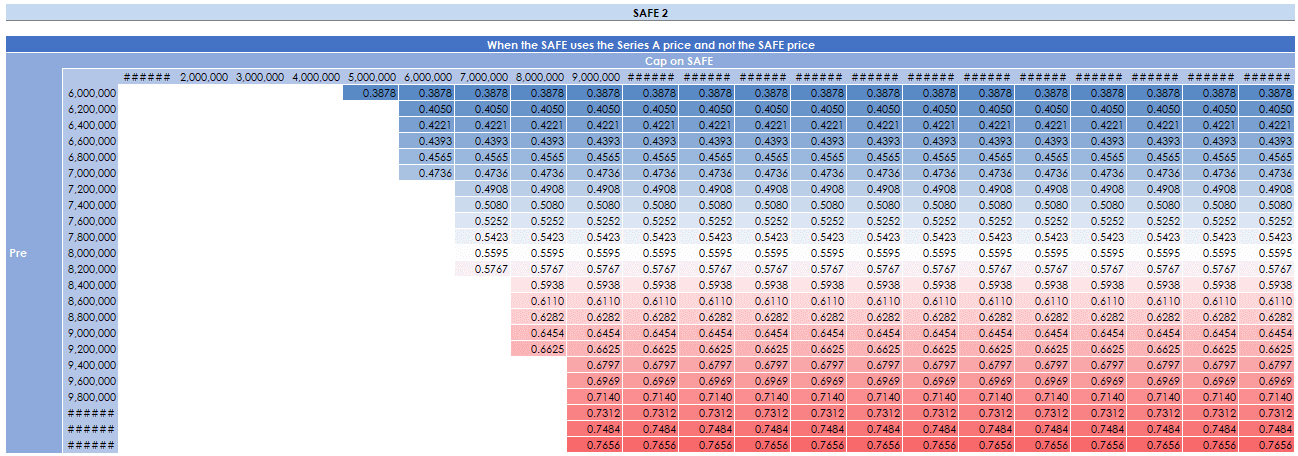
To illustrate when this full ratchet would apply I have made sensitivity tables. When the table is blank, the normal conversion price applies for the SAFE. When you see numbers and colors it means that the series-a (full ratchet) applies.
Here we can see tables for SAFE 1 and 2.
In this example, the full ratchet does not apply on the base example. It will in the next.


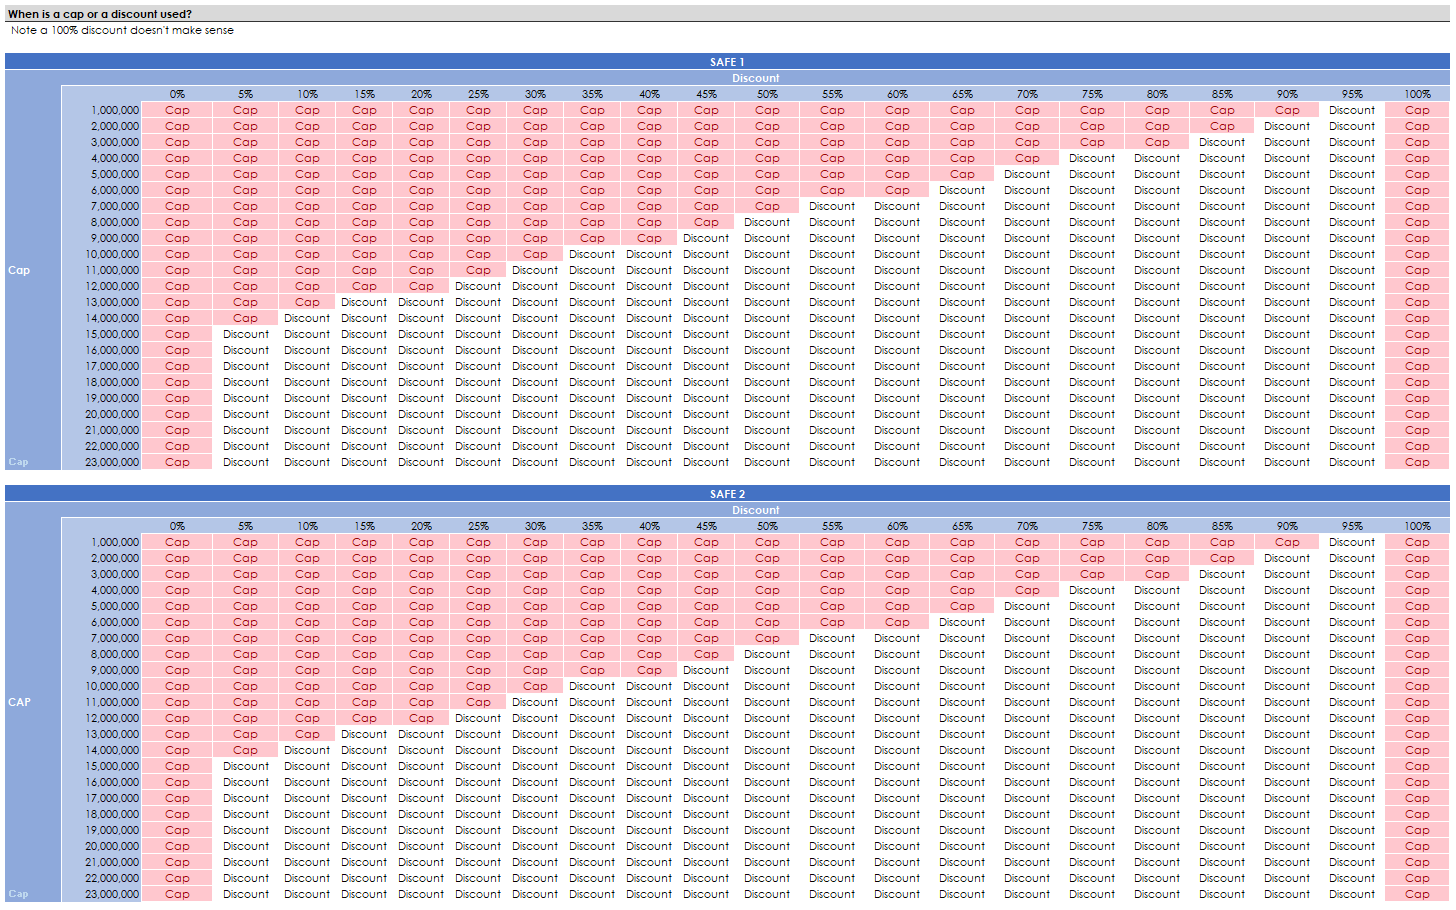
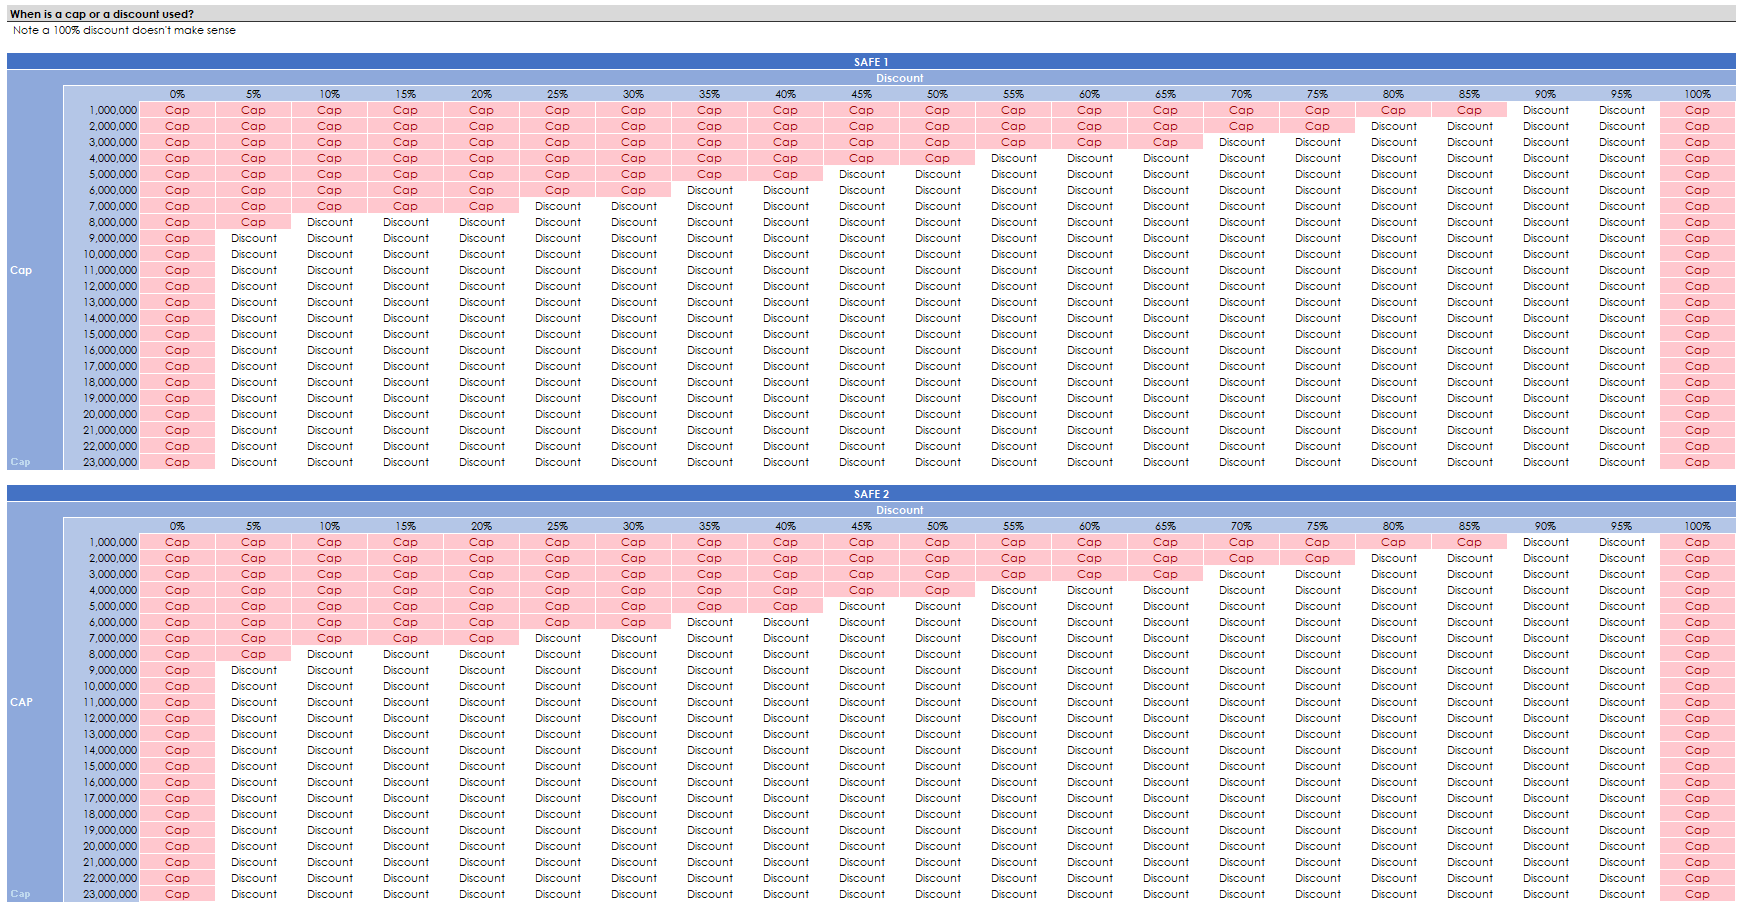
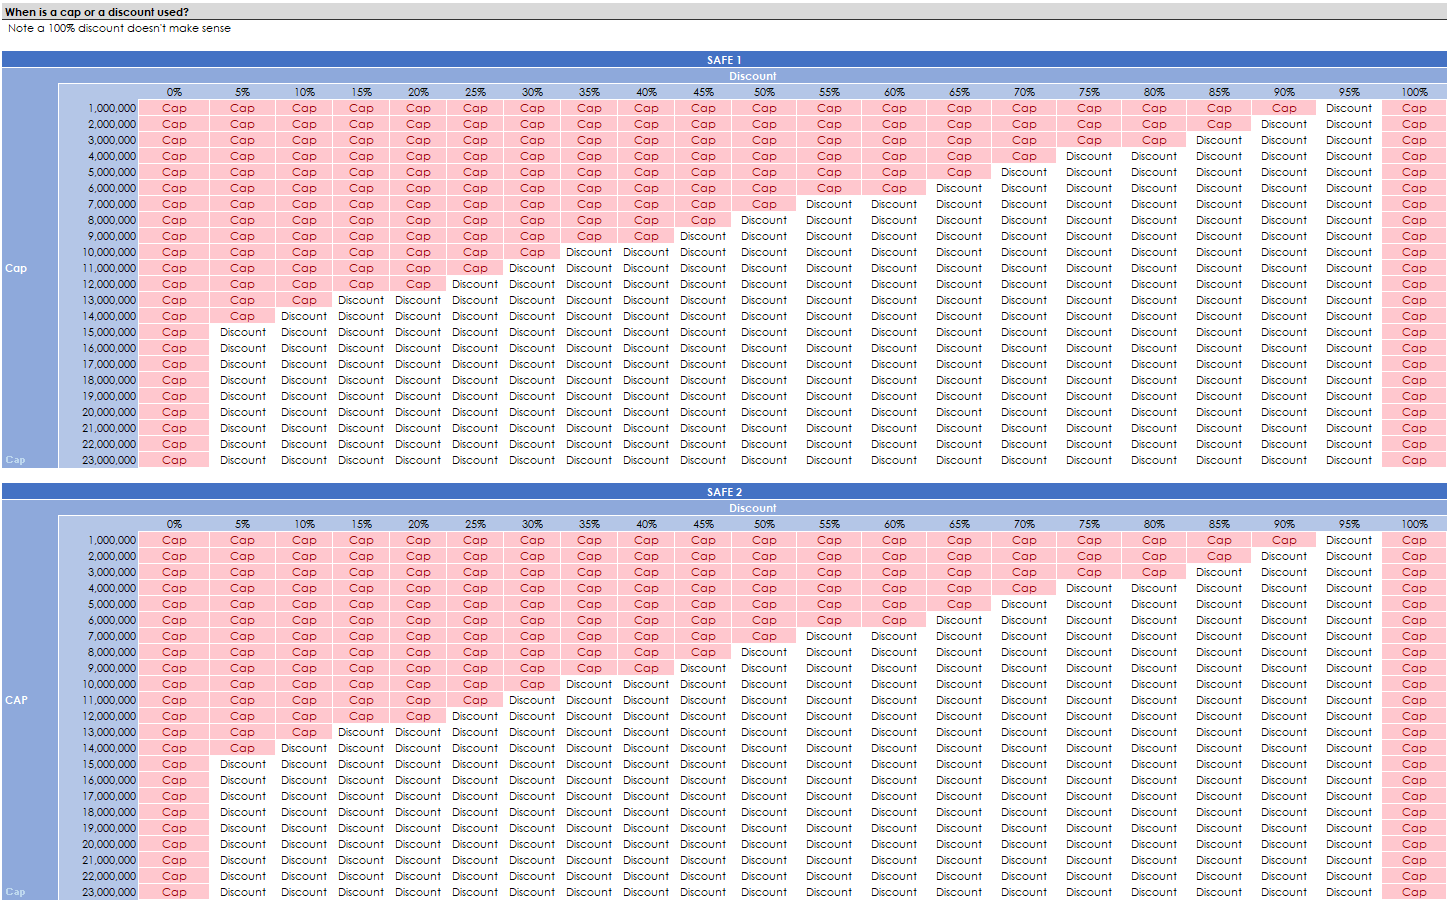
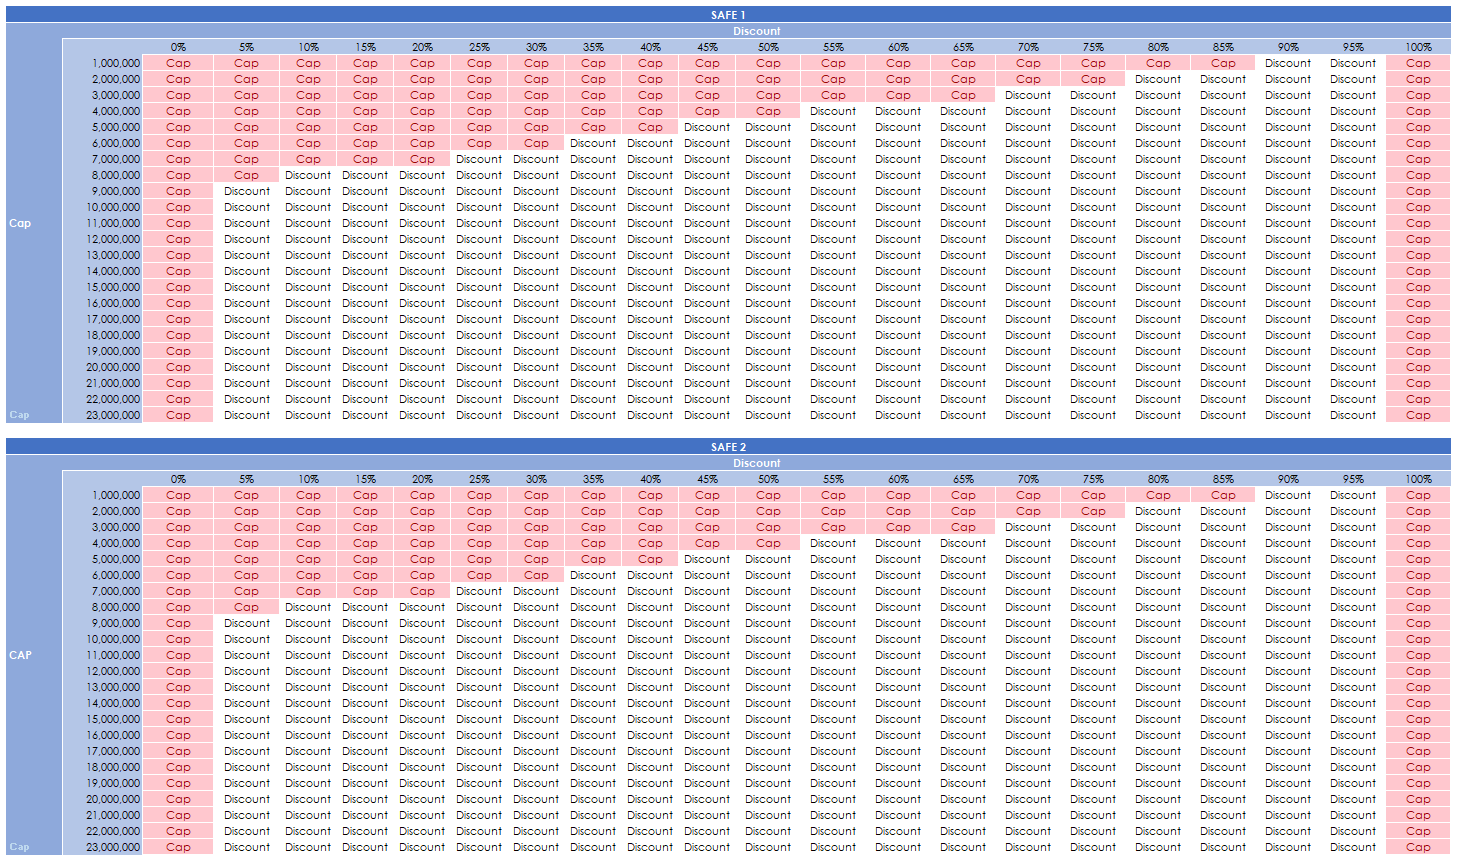
The next tables I made show you when a cap or a discount would apply to the SAFEs. Red and cap means a cap applies. Ignore what happens when the discount is 100% since that is obviously silly.
Obviously the higher the discount, the more likely it is that a discount will apply.
That’s the end of that.
Example 1: Base 2
Now we are on the next main variation. In this example, the pre is lower and we will see that the full ratchet applies.
If you open the model up head to the tab “SAFE – 2 Post Notes”. Hit the second button “Set to $11m post example” to make sure the numbers are right.
Assumptions in the SAFE calculator
Again, in this example there is only a cap, there is no discount.
Shares
Shares are as before.
Series A investment
- The total investment is $2.2m
- The pre-money is $8.8m
- A new ESOP is made of 10% post the S-A investment
- The new lead investor is investing $1.65m. This is the money from new investors
- If we deduct the pro-rata from SAFE 2, there is $323,377 of new money from another new investor
SAFE 1
As before.
SAFE 2
As before.
Rounding in the SAFE calculator
We round down the prices to 4 decimal places
Pricing and share calculations
Prices per share:
- SAFE 1 is $0.3387
- SAFE 2 is $0.6775
- S-A is $0.6577
However, the price used for SAFE 2 is not $0.6775, it is $0.6577 because of the full ratchet. Since the SAFE price is higher than the S-A price, the SAFE automatically takes the lower price of the 2.
1,572,495 new ESOP shares are made to ensure there is a 10% ESOP post the round.
Round calculations
Now we have a series of calculations to spell out how rounds are calculated.
Pre-SAFE: The first is what your cap table looks like with no funding.
Post-SAFE: Now both the SAFEs hit the cap table. Founders have been diluted from 92% to 78%. The SAFE holders have 15.3 (0.3% more because of the full ratchet)%.
Pre-Series A: The increased ESOP hits the cap table. Founders are diluted to 69%. SAFE holders are also diluted a bit, now owning 13.5%.
Post-Series A: The S-A investors are not on the cap table. Founders have 55%. The ESOP is 10%. SAFE own 10.8% in aggregate. Note here, the SAFE 2 have a pro-rata right. This brings their aggregate ownership to 9.333%. So in total SAFE own 12.86%.
You can see how the SAFE calculator matches up with the guide on page 23.
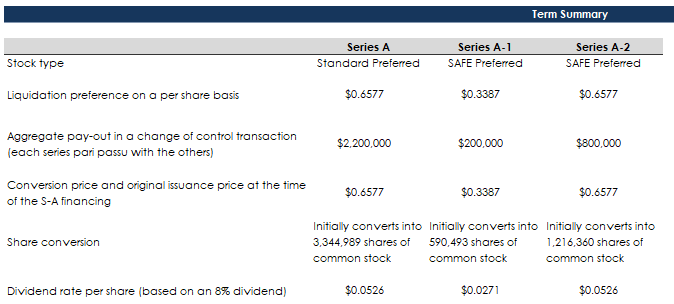
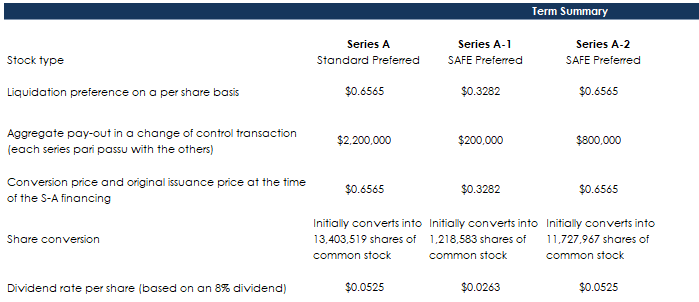
Summary of terms
Here we have a summary of terms.
Acquisition outcomes
On page 20 and 21 there are two examples of what happens to the SAFEs if the company is acquired before the series-a.
These exits examples are not in the docs. I’ve just included them for fun.
Sensitivity tables
Full ratchet tables


Example 2: Base 1
We are on the second example now. The main difference in this example is that one of the notes is the old Pre SAFE note. So there is both a Pre and a Post note.
If you open the model up head to the tab “SAFE – Pre and Post Notes”. Hit the first button “Set to base settings” to make sure the numbers are right.
Assumptions
There is only a cap, there is no discount.
Shares
Shares are as before.
Series A investment
- The total investment is $5m
- The pre-money is $15m
- A new ESOP is made of 10% post the S-A investment
- The new lead investor is investing $4m. This is the money from new investors
- If we deduct the pro-rata from SAFE 2, there is $694,903 of new money from another new investor
SAFE 1
- This is a pre-money SAFE
- They invest $200k at a $3.8m cap
- There is no pro-rata
SAFE 2
- This is a post-money SAFE
- They invest $800k at a $8m cap
- There is a pro-rata
Rounding in the SAFE calculator
We round down the prices to 4 decimal places

Prices per share:
- SAFE 1 is $0.3248
- SAFE 2 is $0.6782
- S-A is $1.1115
The calculations for the pre note are different from the post note. You can follow the calculations to see how they are done. Note for example the denominators of shares and how they are composed.
The pre note includes the ESOP, whereas the post note does not.
The post note includes the pre and post note in the denominator. whereas the pre note does not.
1,699,370 new ESOP shares are made to ensure there is a 10% ESOP post the round.
Round calculations
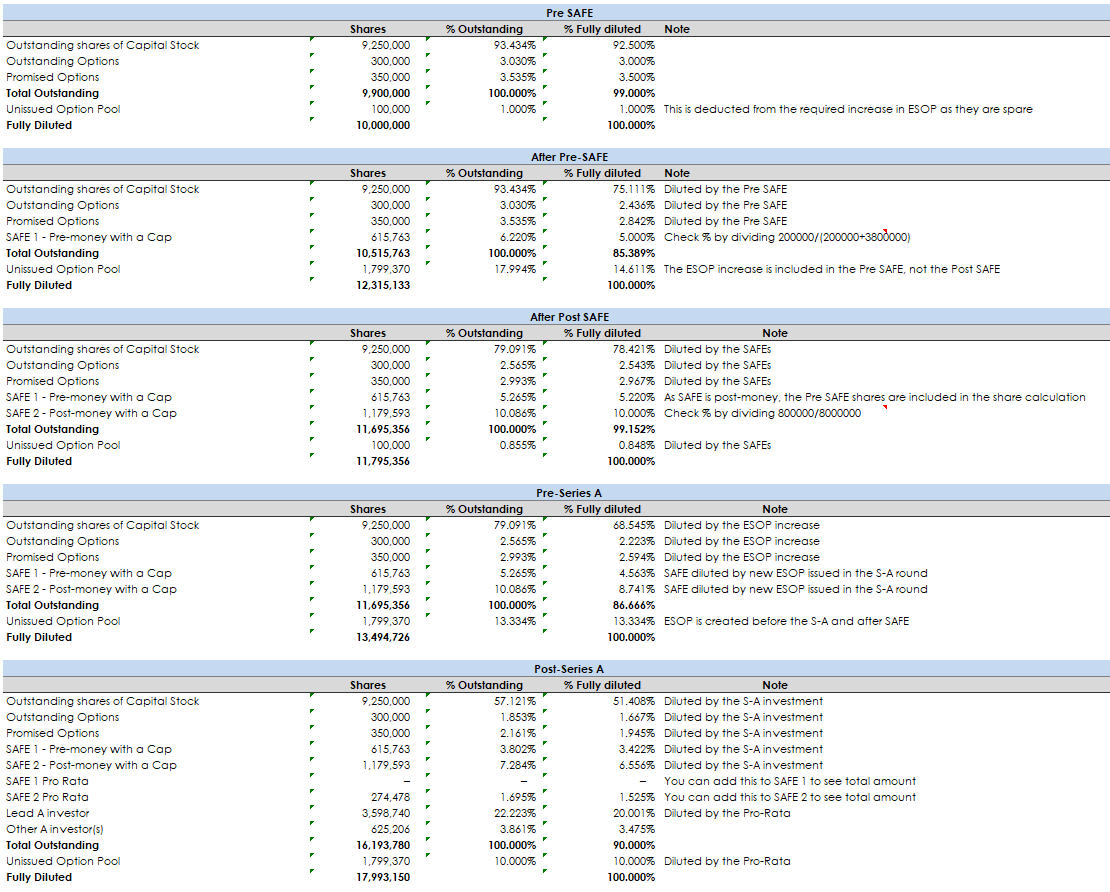
Now we have a series of calculations to spell out how rounds are calculated.
Pre-SAFE: The first is what your cap table looks like with no funding. See there are 10m shares.
After pre-SAFE: First, we do the calculation for the pre note as it needs to be included in the post-note calculation. You can see the ESOP included in the cap table.
After post-SAFE: Next we do the post note. Both the SAFEs hit the cap table. Founders have been diluted from 92.5% to 78.4%. The SAFE holders have 15.22%.
Pre-Series A: The increased ESOP hits the cap table officially. Founders are diluted to 68%. SAFE holders are also diluted a bit, now owning 13.3%.
Post-Series A: The S-A investors are now on the cap table. Founders have 51%. The ESOP is 10%. SAFE own 9.978% in aggregate. Note here, the SAFE 2 have a pro-rata right. This brings their aggregate ownership to 8.081%. So in total SAFE own 11.503%. The series-A new investors own 23.475%.
You can see how the SAFE calculator matches up with the guide on page 25.
Summary of terms
Here we have a summary of terms.
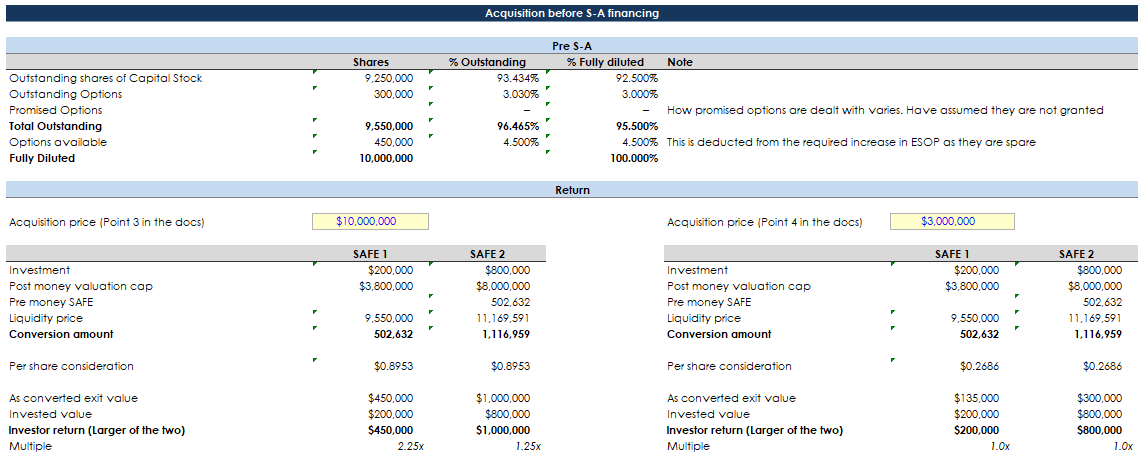
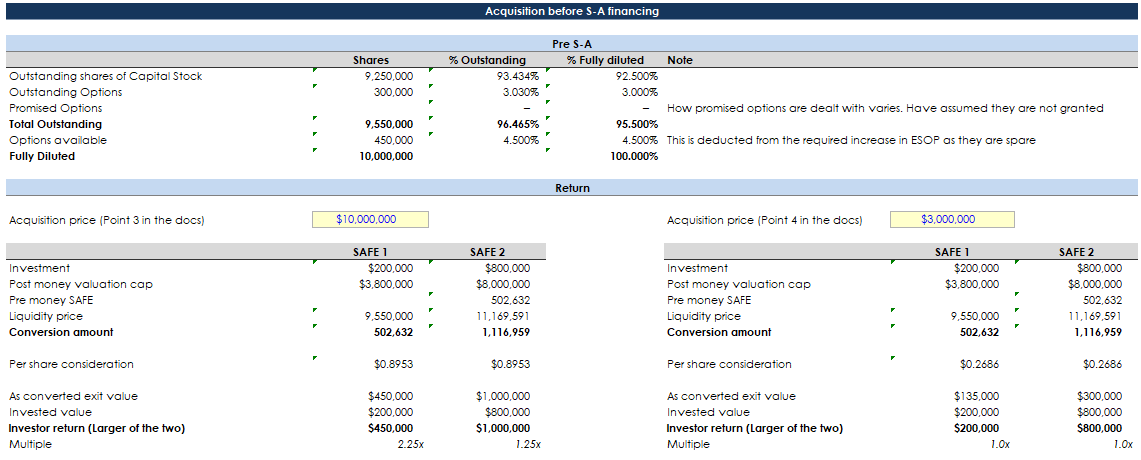
Acquisition outcomes
On page 25 and 26 there are two examples of what happens to the SAFEs if the company is acquired before the series-a.
Example one you are acquired for $10m
In this case, the SAFE 1 can convert to one of the 2 options:
- As converted exit value: This is $450k
- Invested value: This is $200k
The investor converts into $450k and takes a 2.25x return on their investment.
In this case, the SAFE 2 can convert to one of the 2 options:
- As converted exit value: This is $1m
- Invested value: This is $800k
The investor converts into $1m and takes a 1.25x return on their investment.
Example two you are acquired for $3m
In this case, the SAFE 1 can convert to one of the 2 options:
- As converted exit value: This is $135k
- Invested value: This is $200k
The investor converts into $200k and gets their money back.
In this case, the SAFE 2 can convert to one of the 2 options:
- As converted exit value: This is $300k
- Invested value: This is $800k
The investor converts into $800k and gets their money back.
Sensitivity tables
Full ratchet tables
Cap vs discount tables
That’s the end of that.
Example 2: Base 2
Now we are on the next main variation. In this example, the pre is lower and we will see that the full ratchet applies.
If you open the model up head to the tab “SAFE – Pre and Post Notes”. Hit the second button “Set to $11m post example” to make sure the numbers are right.
Assumptions in the SAFE calculator
Again, in this example there is only a cap, there is no discount.
Shares in the SAFE calculator
Shares are as before.
Series A investment
- The total investment is $2.2m
- The pre-money is $8.8m
- A new ESOP is made of 10% post the S-A investment
- The new lead investor is investing $1.65m. This is the money from new investors
- If we deduct the pro-rata from SAFE 2, there is $323,365 of new money from another new investor
SAFE 1
As before.
SAFE 2
As before.
Rounding in the SAFE calculator
We round down the prices to 4 decimal places
Pricing and share calculations
Prices per share:
- SAFE 1 is $0.3282
- SAFE 2 is $0.6763
- S-A is $0.6565
However, the price used for SAFE 2 is not $0.6763, it is $0.6565 because of the full ratchet. Since the SAFE price is higher than the S-A price, the SAFE automatically takes the lower price of the 2.
1,575,552 new ESOP shares are made to ensure there is a 10% ESOP post the round.
Round calculations
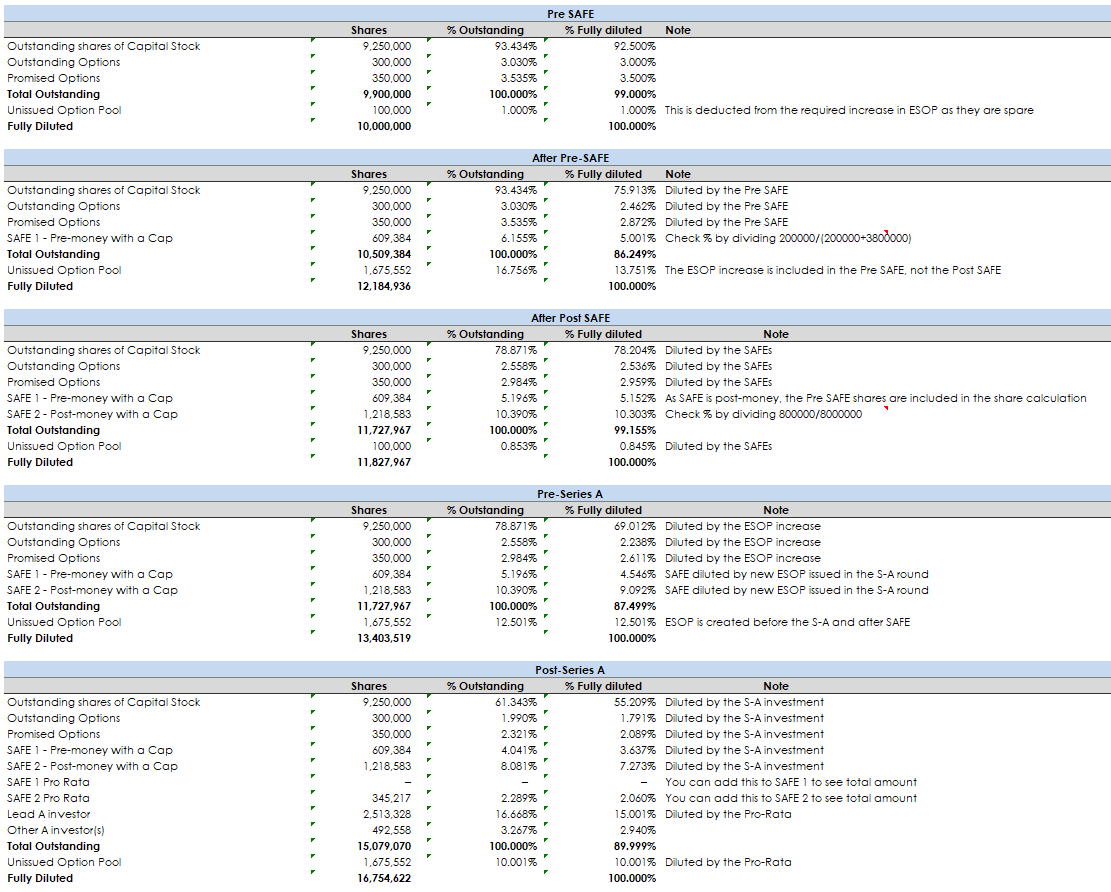
Now we have a series of calculations to spell out how rounds are calculated.
Pre-SAFE: The first is what your cap table looks like with no funding. See there are 10m shares.
After pre-SAFE: First, we do the calculation for the pre note as it needs to be included in the post-note calculation. You can see the ESOP included in the cap table. The pre-SAFE get 5%.
After post-SAFE: Next, we do the post note. Both the SAFEs hit the cap table. Founders have been diluted from 92.5% to 78.2%. The SAFE holders have 15.455%.
Pre-Series A: The increased ESOP hits the cap table officially. Founders are diluted to 69%. SAFE holders are also diluted a bit, now owning 13.628%.
Post-Series A: The S-A investors are now on the cap table. Founders have 55%. The ESOP is 10%. SAFE own 10.91% in aggregate. Note here, the SAFE 2 have a pro-rata right. This brings their aggregate ownership to 9.334%. So in total SAFE own 12.971%. The series-A new investors own 17.941%.
You can see how the SAFE calculator matches up with the guide on page 28.
Summary of terms
Here we have a summary of terms in the SAFE calculator.
Acquisition outcomes
These exits examples are not in the docs. I’ve just included them for fun.
Sensitivity tables
Full ratchet tables


Cap vs discount tables
Conclusion on the SAFE calculator
Download the SAFE calculator and have a play. The only way you are really going to understand is by digging in and learning.