

Tl;dr: Part of a collection of real examples of M&A investment banking slides. This blog covers Regression Analysis. See the PowerPoint presentations investment bankers are paid millions for. No matter your job, or your aspirations, you can learn from these slides.
This is part of a collection of 67 free M&A presentations from the top 20 banks (based on ranking, and also the quality of presentation for you to learn from).
Collection of M&A slide examples
The main page for all the M&A resources is here.
I have broken out 827 examples of slides across 32 sections. You can click through to the section you want to learn about next here:
Is this blog for you?
Why the heck should you care? Investment banks (historically) attracted the best and the brightest.
- Slide structure/design: Learn how complicated concepts are structured and designed in PowerPoint
- Analysis approach: See exactly how complex financial methods are presented
- Strategy and communication: M&A deals are not (normally, other than many Duff and Phelps decks) cookie cutter. There’s a host of topics that need to be dealt with
- Morbid interest: I used to do this for a living, but it’s still interesting to see how PPT are made… but then maybe it’s just me and so FML 😉
Who this will help:
- You want to work in banking: There’s a lot of applicants. Knowing the job helps you answer questions
- You work in banking: Even if you’re an MD, you need to know how the best are structuring their thoughts/analysis
- You write presentations: You can’t buy learnings like this. You can learn from the slides
- You have a curious mind: Good for you
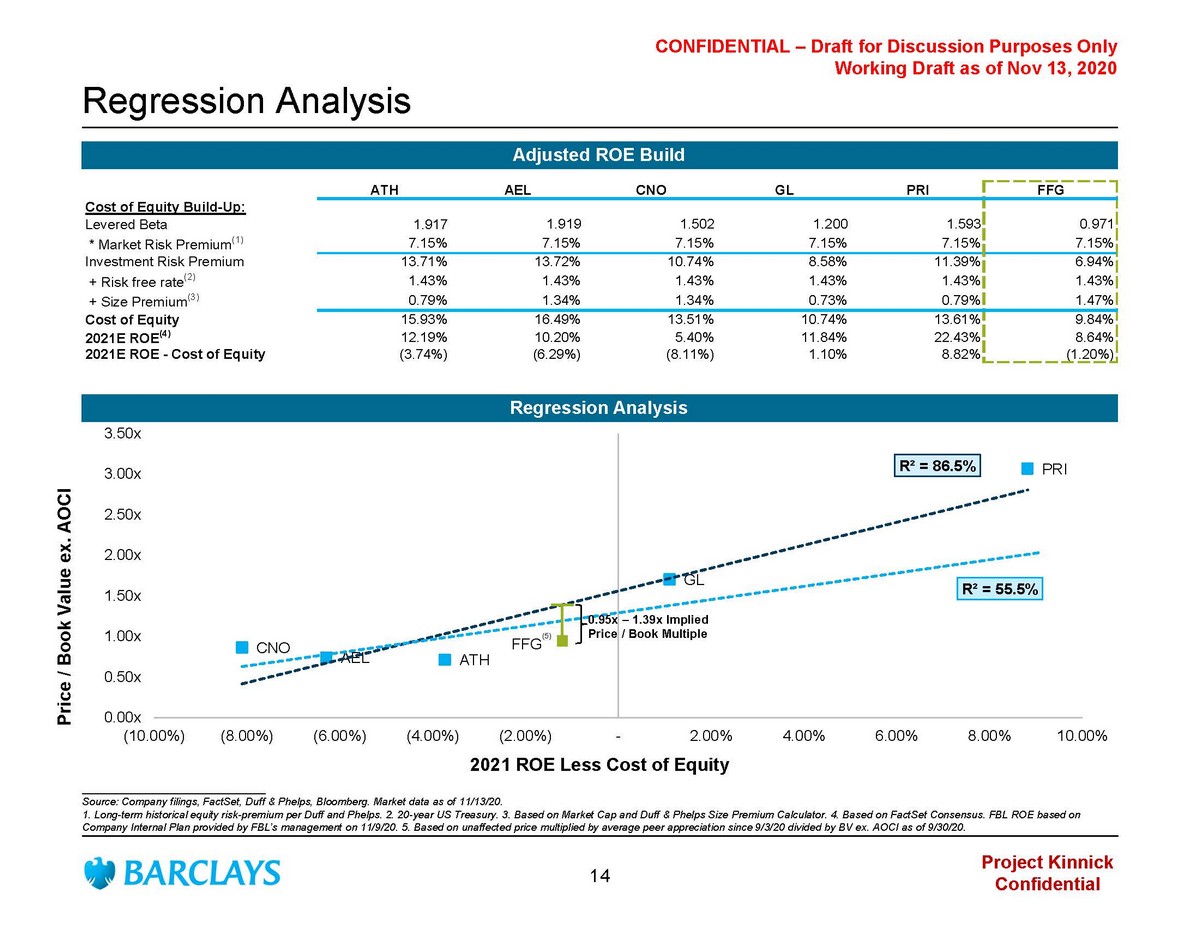
About Regression Analysis
Regression analysis is basically a simple statistical method that allows you to examine the relationship between two or more variables of interest.
Let’s say you are analyzing your call center. You get lots of data from different calls and you could plot data points of wait time and drop-off rates. You would likely see a correlation between longer wait times and higher drop-offs. If there’s a really high correlation, you would say there is a 100% correlation, or 1. That’s number is the r2.
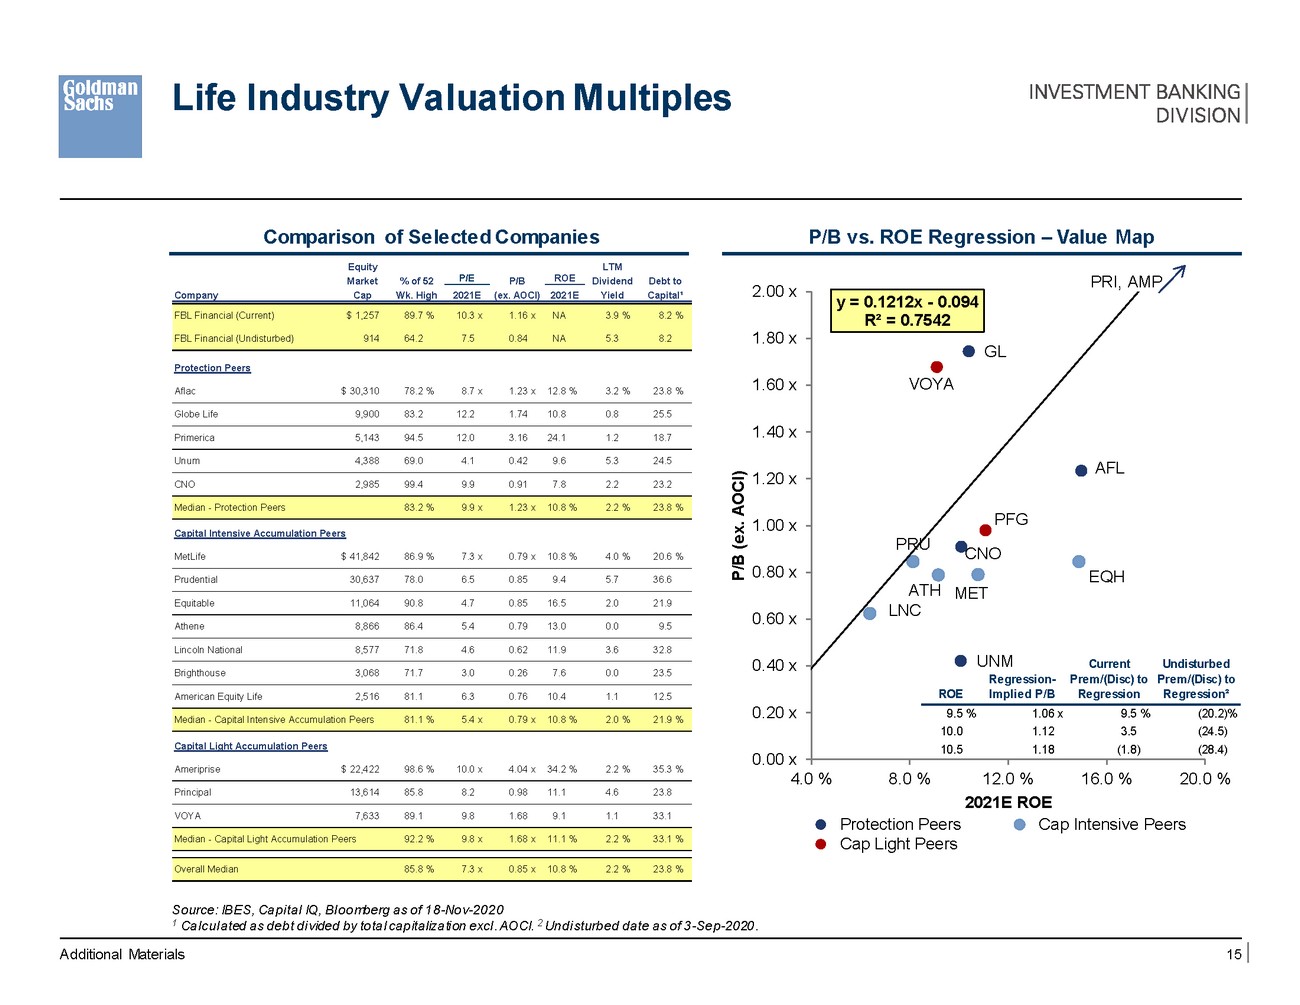
You would be able to create a y formula which spits out a formula based on your data such as y = 0.1212x – 0.094, and an r2 of 0.7542.
- y is the dependent you are looking for such as the price to book ratio
- x gets multiplied by your return on equity
- and the – 0.094 is an error which sort of says not everything is accurate here
- the r2 says there is a 75% fit which is pretty solid as r2 go
So you input your client’s ROE and the formula says what it expects your PB to be.
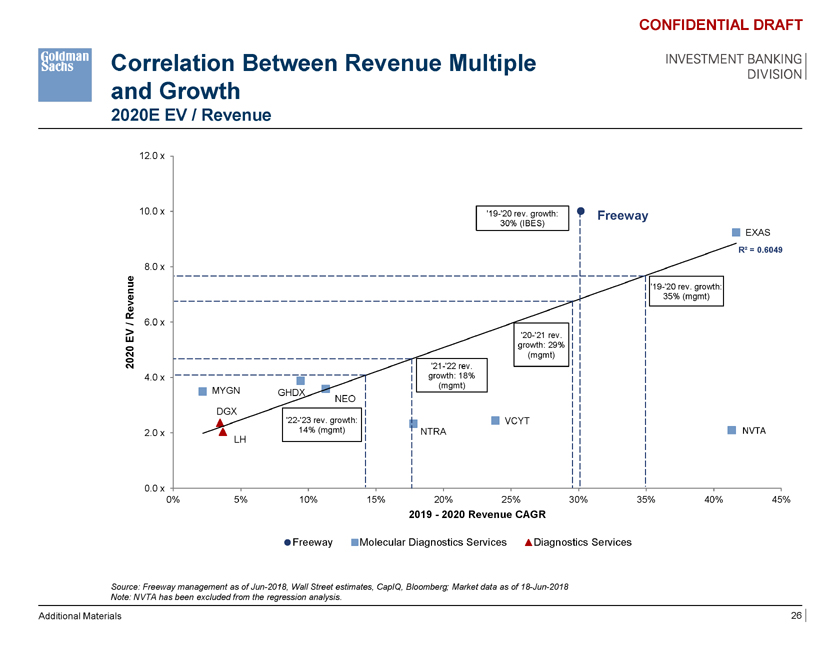
Now you can do other things which is making a line of fit (which you can see on all the graphs). Here you can see how your data points fit along the line. If they fit closely then you expect the r2 to be high. If they are all over the shop, then your analysis is probably pointless.
In banking, you sort of learn which variables got together and keep doing the same types of analysis.
This is a really dumbed-down explanation. I recommend reading some blogs on it, then opening up Excel and just giving it a test. It’s pretty easy to do, but harder to master.
Why these slides are made
I went on to a banking forum with a question about whether bankers actually use regression. I thought this would be interesting to you.
- We use it all the time too. As an example, the primary driver between one of our covered companies is the mix between product segment X and Y. So I ran a regression on change in mix to consolidates GP (R^2 = 95%+). Now, I can model the growth of each product line separately and have gross margin as an output. This effectively reduces my margin of error.
- I used it in IB all the time. Specifically to estimate what a client company’s newly issued debt would be rated in comparison to its peers based on a number of multiples and metrics.
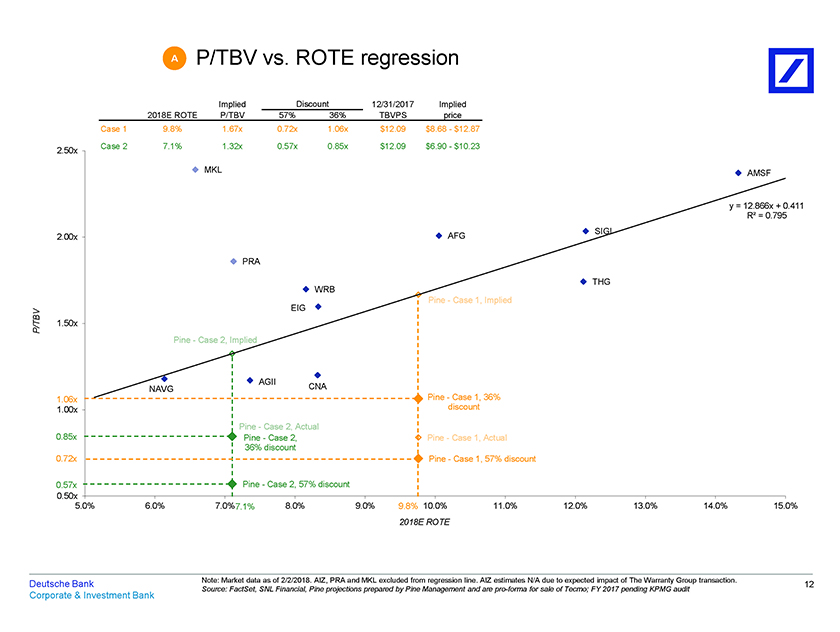
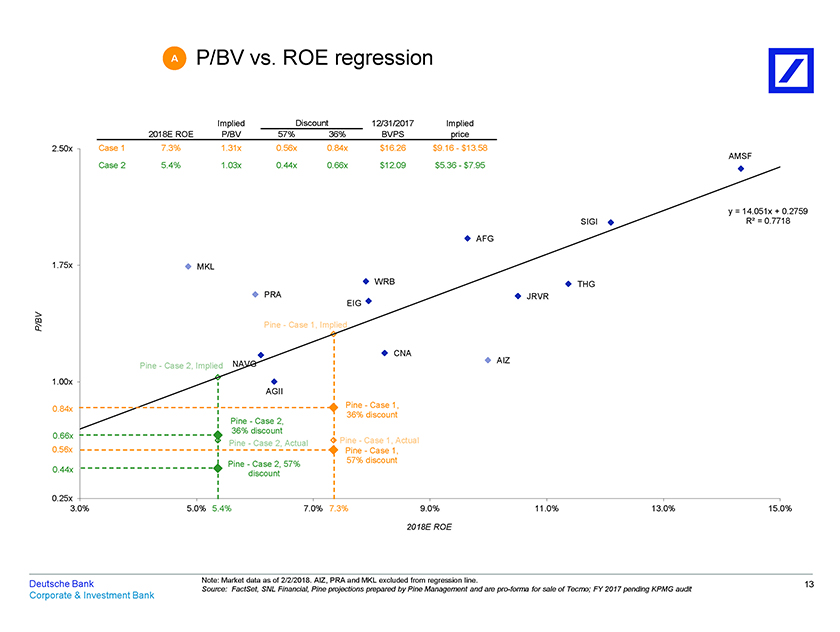
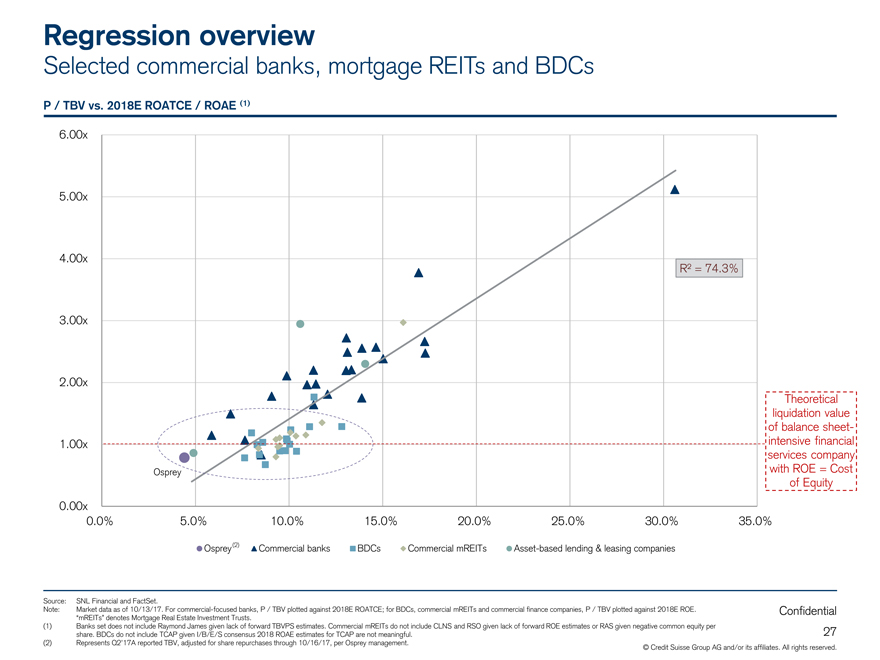
- I’ve used regression analysis to value a company. You take a comp set’s ROATCE and their P/TBV come up with a regression line. Plug in your targets ROATCE and you come out with a price.
- The analyst that I used to work for told me that in industry (he used to work at Unilever) they used regression to forecast things like future air travel passengers and the company would base its budget/targets off of that. He initially wanted to use it in the ER reports but was shut down by product control, as they don’t feel that it’s legitimate.
- The effectiveness of using a regression model will depend on the sector. For an O&G company it’s obvious that the top line will depend on the price of oil. The problem with regressions as I see it is that you need at least 40/50 data points for a normal distribution bell-curve, so maybe 40/50 quarters, which in itself is not hard to come by for most S&P 500 companies. The main issue is nonstationary data or ‘breaks’ in the data where different parts of the time series have different statistical properties. This usually happens due to changes in the sector: technology or regulatory changes being the major factors. I would avoid using regressions unless you know how to test for breaks and make adjustments.
Comments on making these slides
Things can get complicated, but you might not want to let it
As a banker, you make slides for clients and the clients need to understand them. If you are a math nerd and do some advanced fancy stuff, then your client may not understand it. Most clients will understand basic regression. So just because you can do something fancy, doesn’t mean you should.
Examples of Regression Analysis


Want to learn more about investment banking presentations?
Want easy access to knowledge?