


Tl;dr: Part of a collection of real examples of M&A investment banking slides. This blog covers Accretion Dilution. See the PowerPoint presentations investment bankers are paid millions for. No matter your job, or your aspirations, you can learn from these slides.
This is part of a collection of 67 free M&A presentations from the top 20 banks (based on ranking, and also the quality of presentation for you to learn from).
Why the heck should you care? Investment banks (historically) attracted the best and the brightest.
- Slide structure/design: Learn how complicated concepts are structured and designed in PowerPoint
- Analysis approach: See exactly how complex financial methods are presented
- Strategy and communication: M&A deals are not (normally, other than many Duff and Phelps decks) cookie cutter. There’s a host of topics that need to be dealt with
- Morbid interest: I used to do this for a living, but it’s still interesting to see how PPT are made… but then maybe it’s just me and so FML 😉
Who this will help:
- You want to work in banking: There’s a lot of applicants. Knowing the job helps you answer questions
- You work in banking: Even if you’re an MD, you need to know how the best are structuring their thoughts/analysis
- You write presentations: You can’t buy learnings like this. You can learn from the slides
- You have a curious mind: Good for you
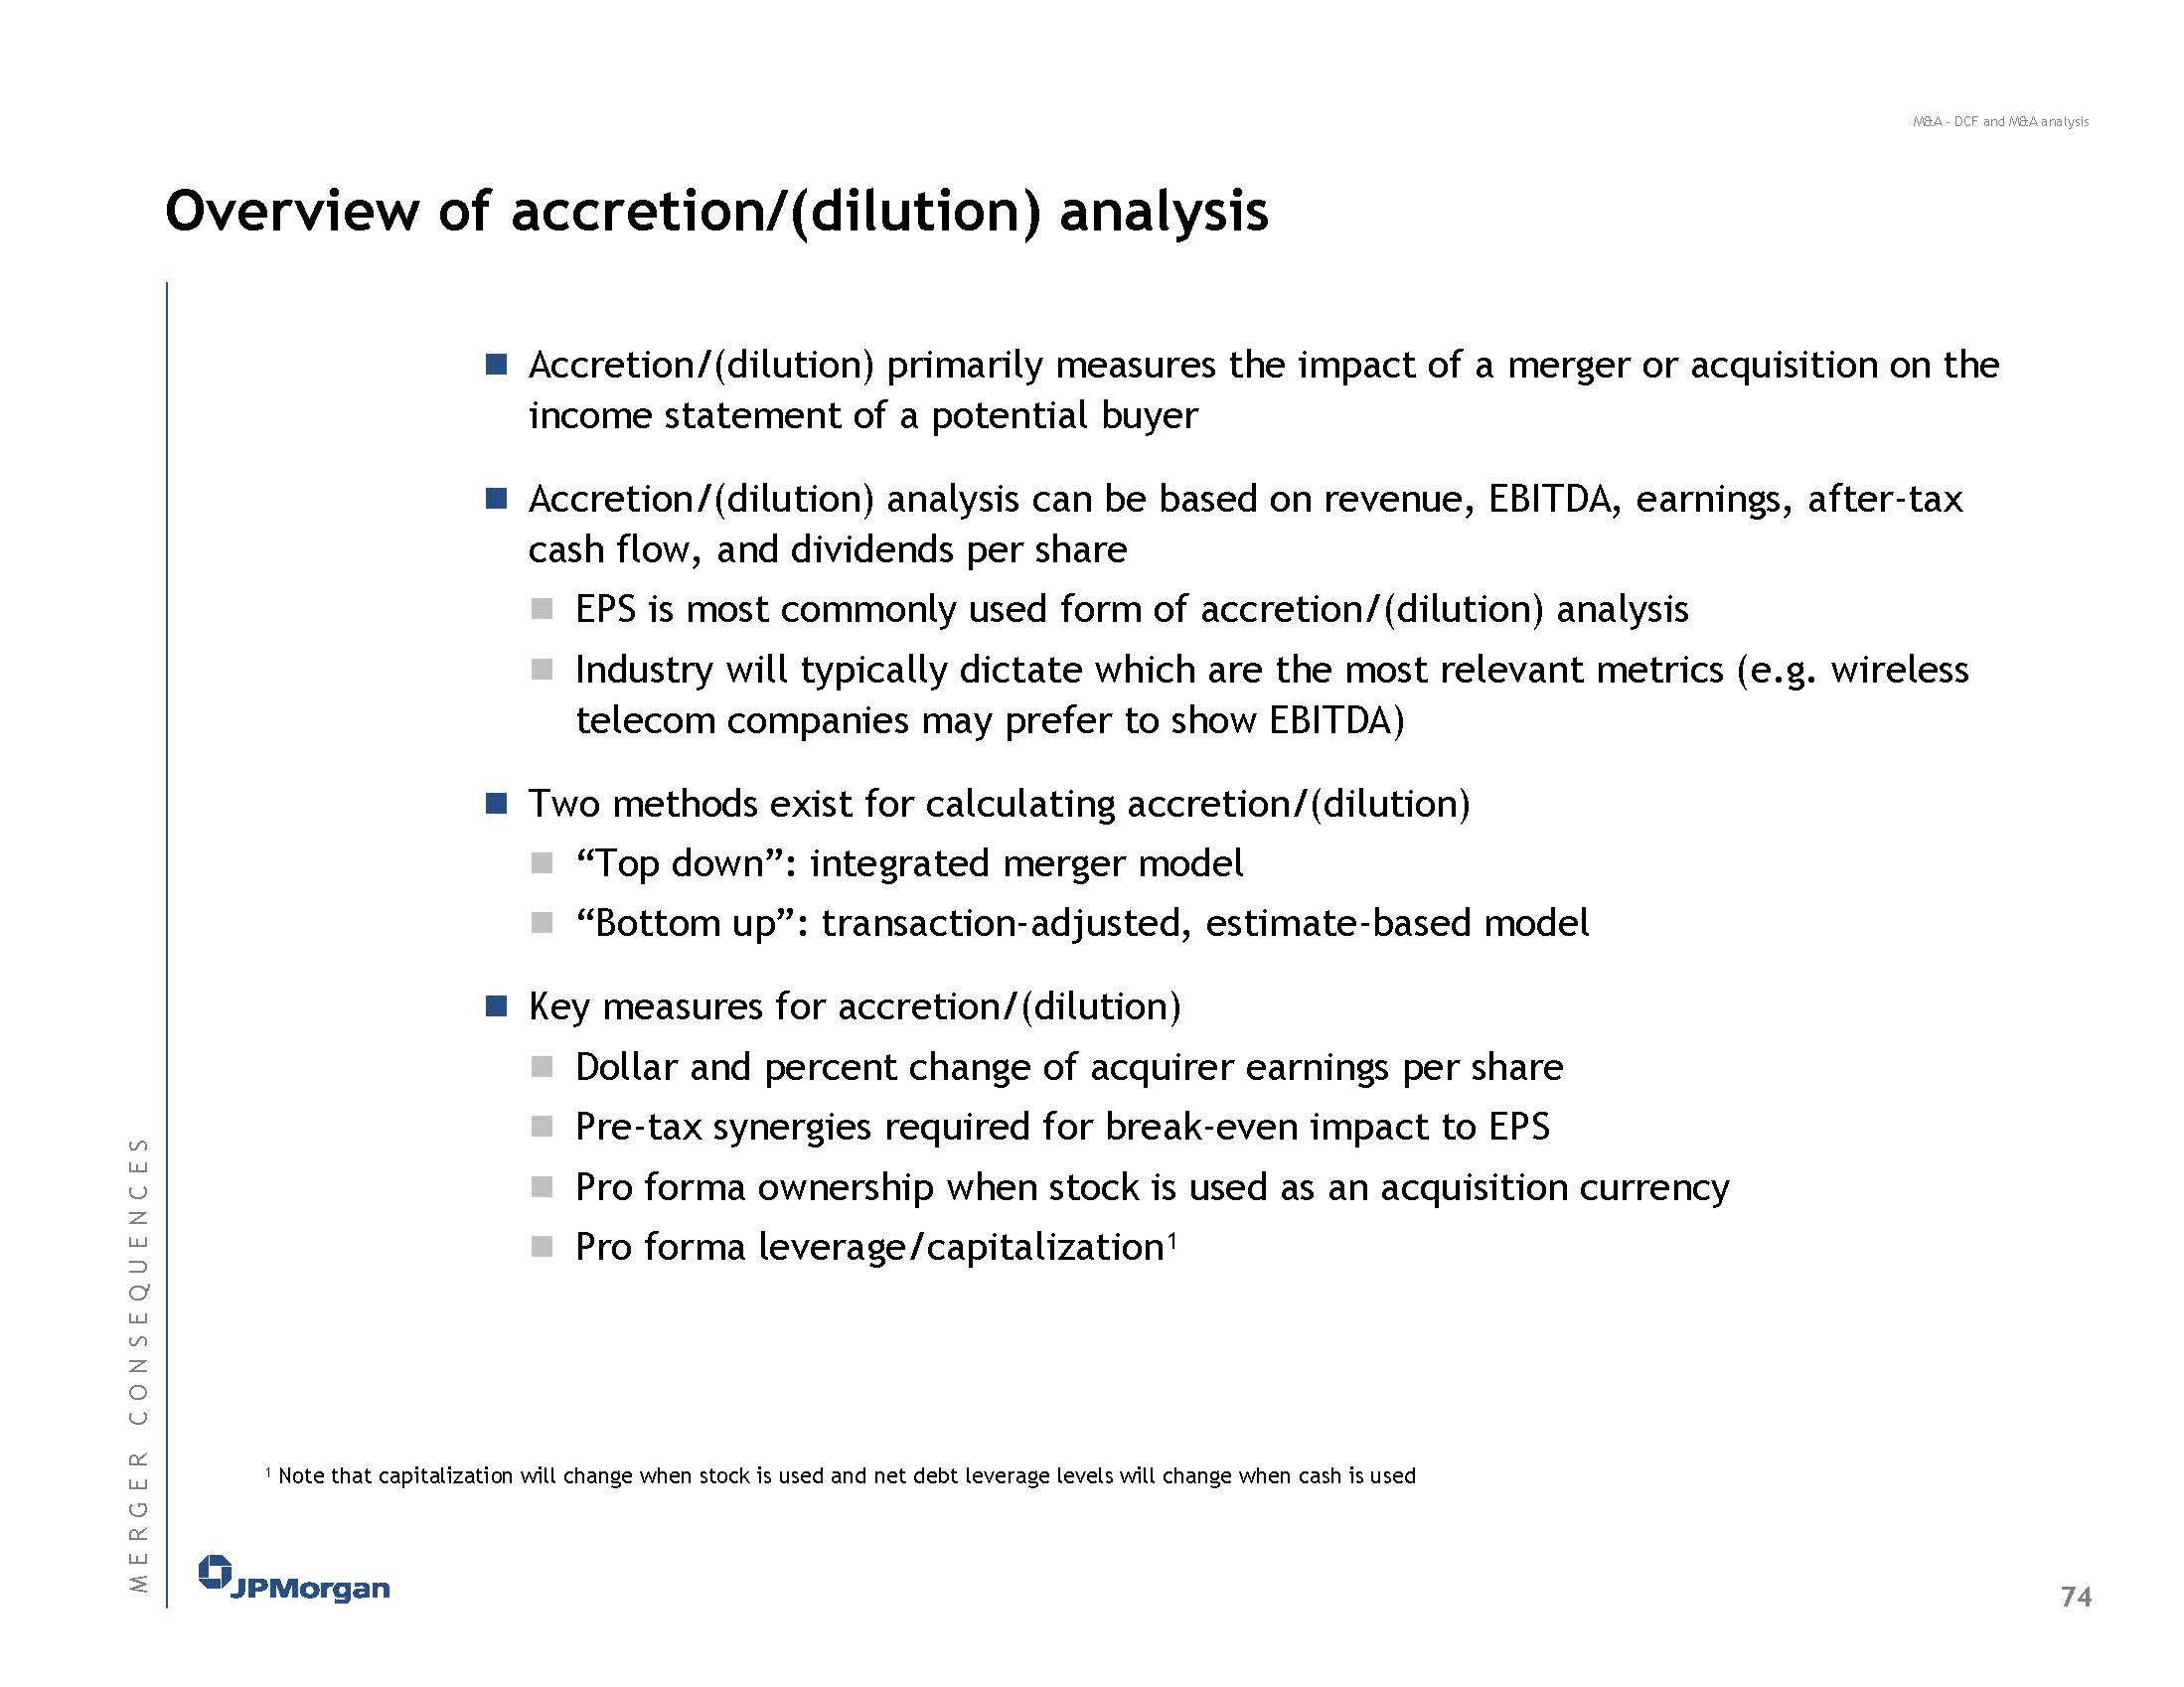
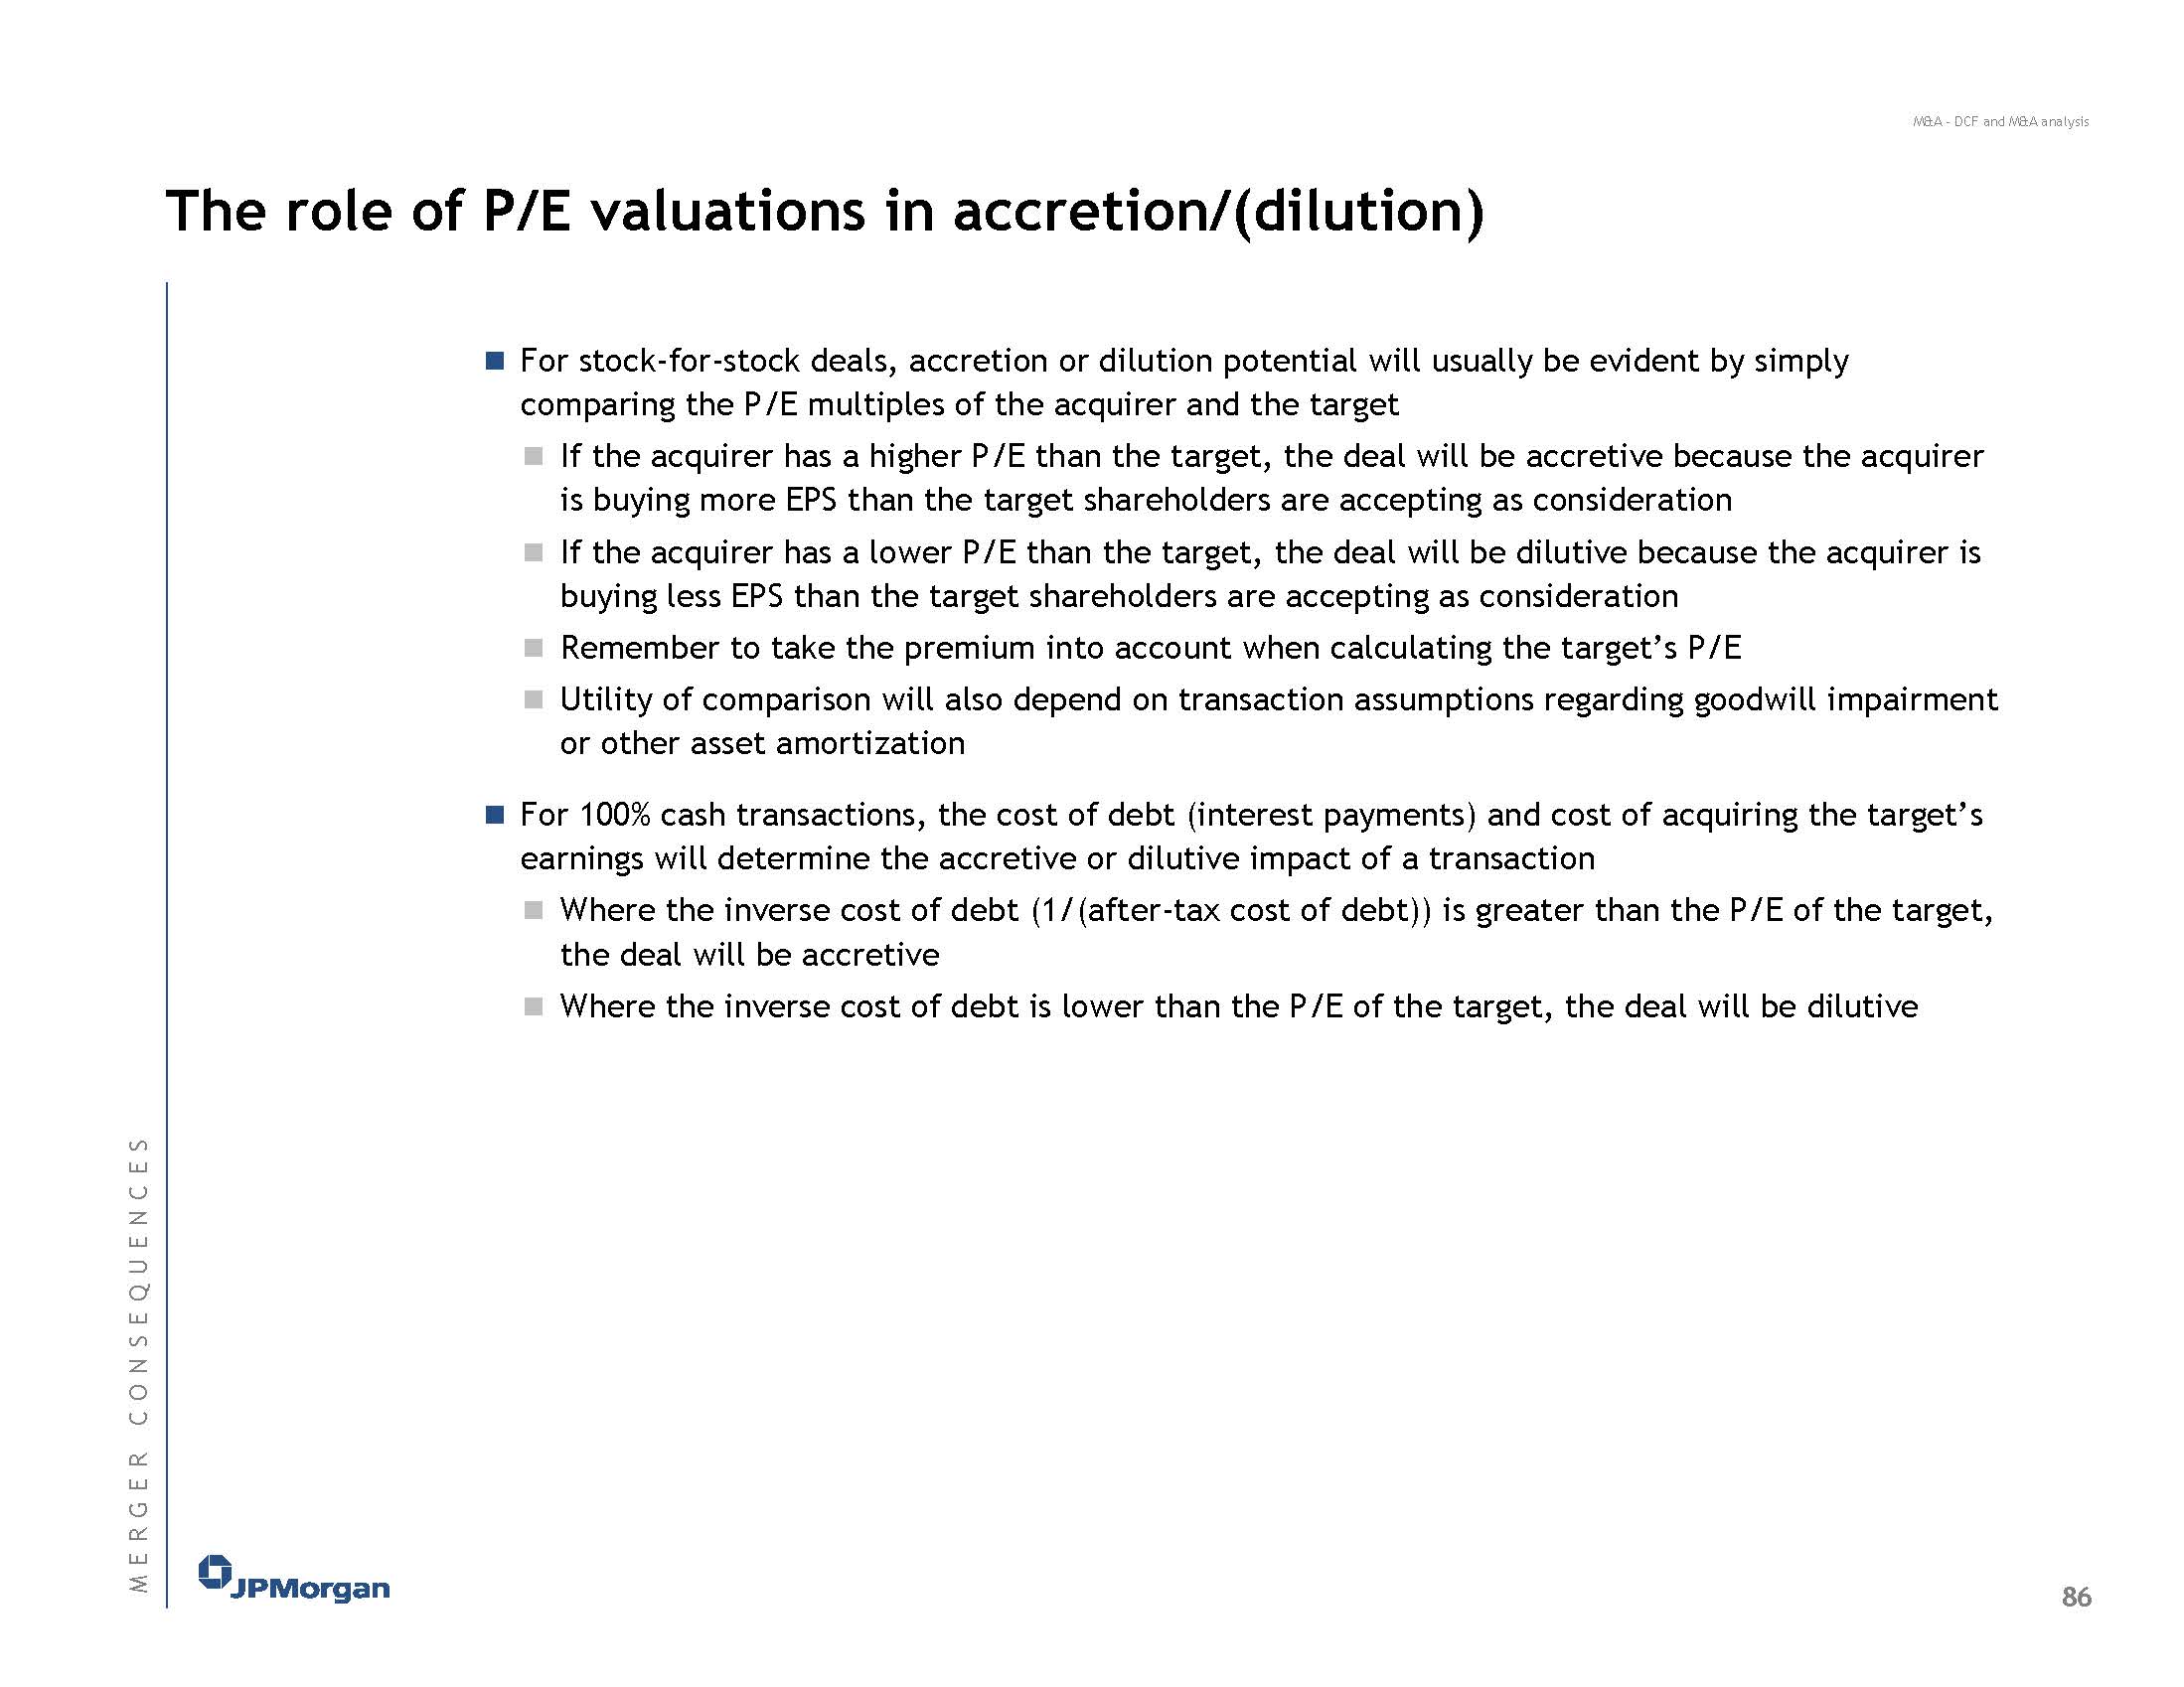
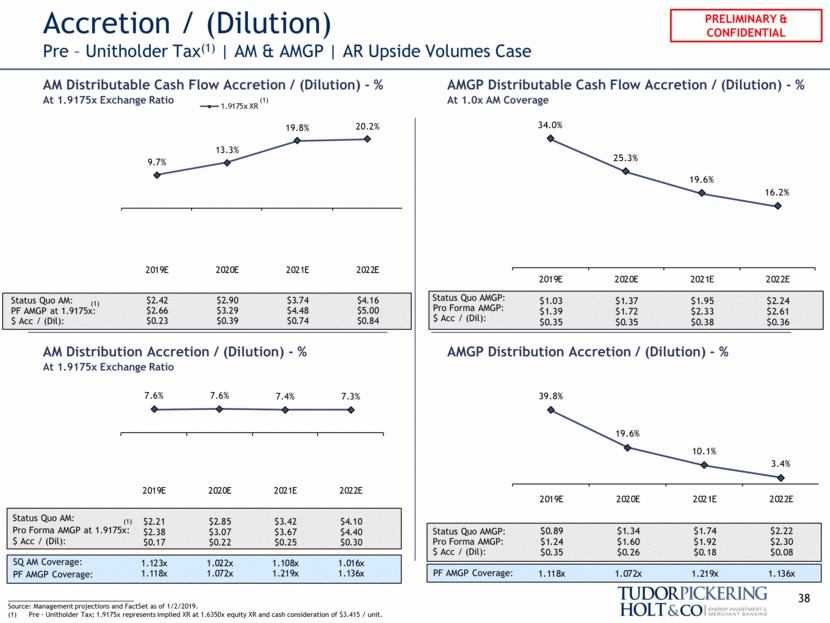
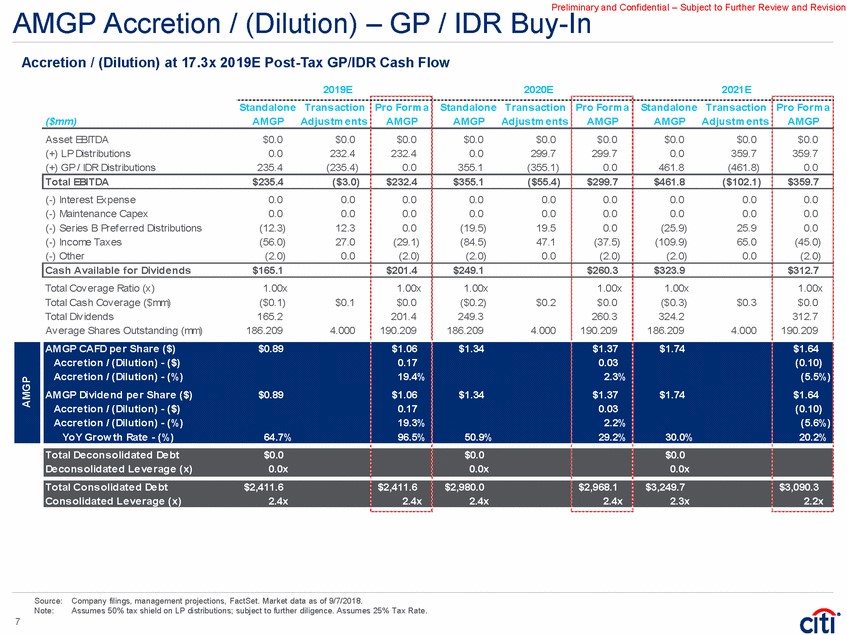
About Accretion Dilution
Does a deal make you money, or lose you money, but on a share basis?
So you divide:
- “earnings” over
- shares
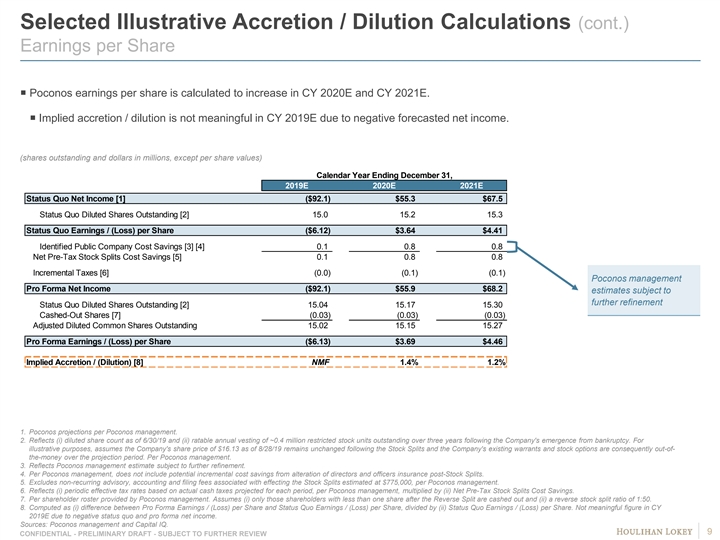
You then arrive at EPS, or Earning Per Share.
If you do an M&A deal and you fund it through equity, basically you do the company version of quantitative easing and issue shares to the company you buy (well, their shareholders).
What this means is you:
- Take the earnings of the new company (Which increases earnings in the numerator)
- Issue more shares (Which means more shares in the denominator)
You hope to fricking gosh that when you dive the numbers the EPS is higher than what it was before.
Why do you care about this? Well, research analysts and institutional investors track your EPS and hence your market cap/enterprise value will go up and down based on what they think.
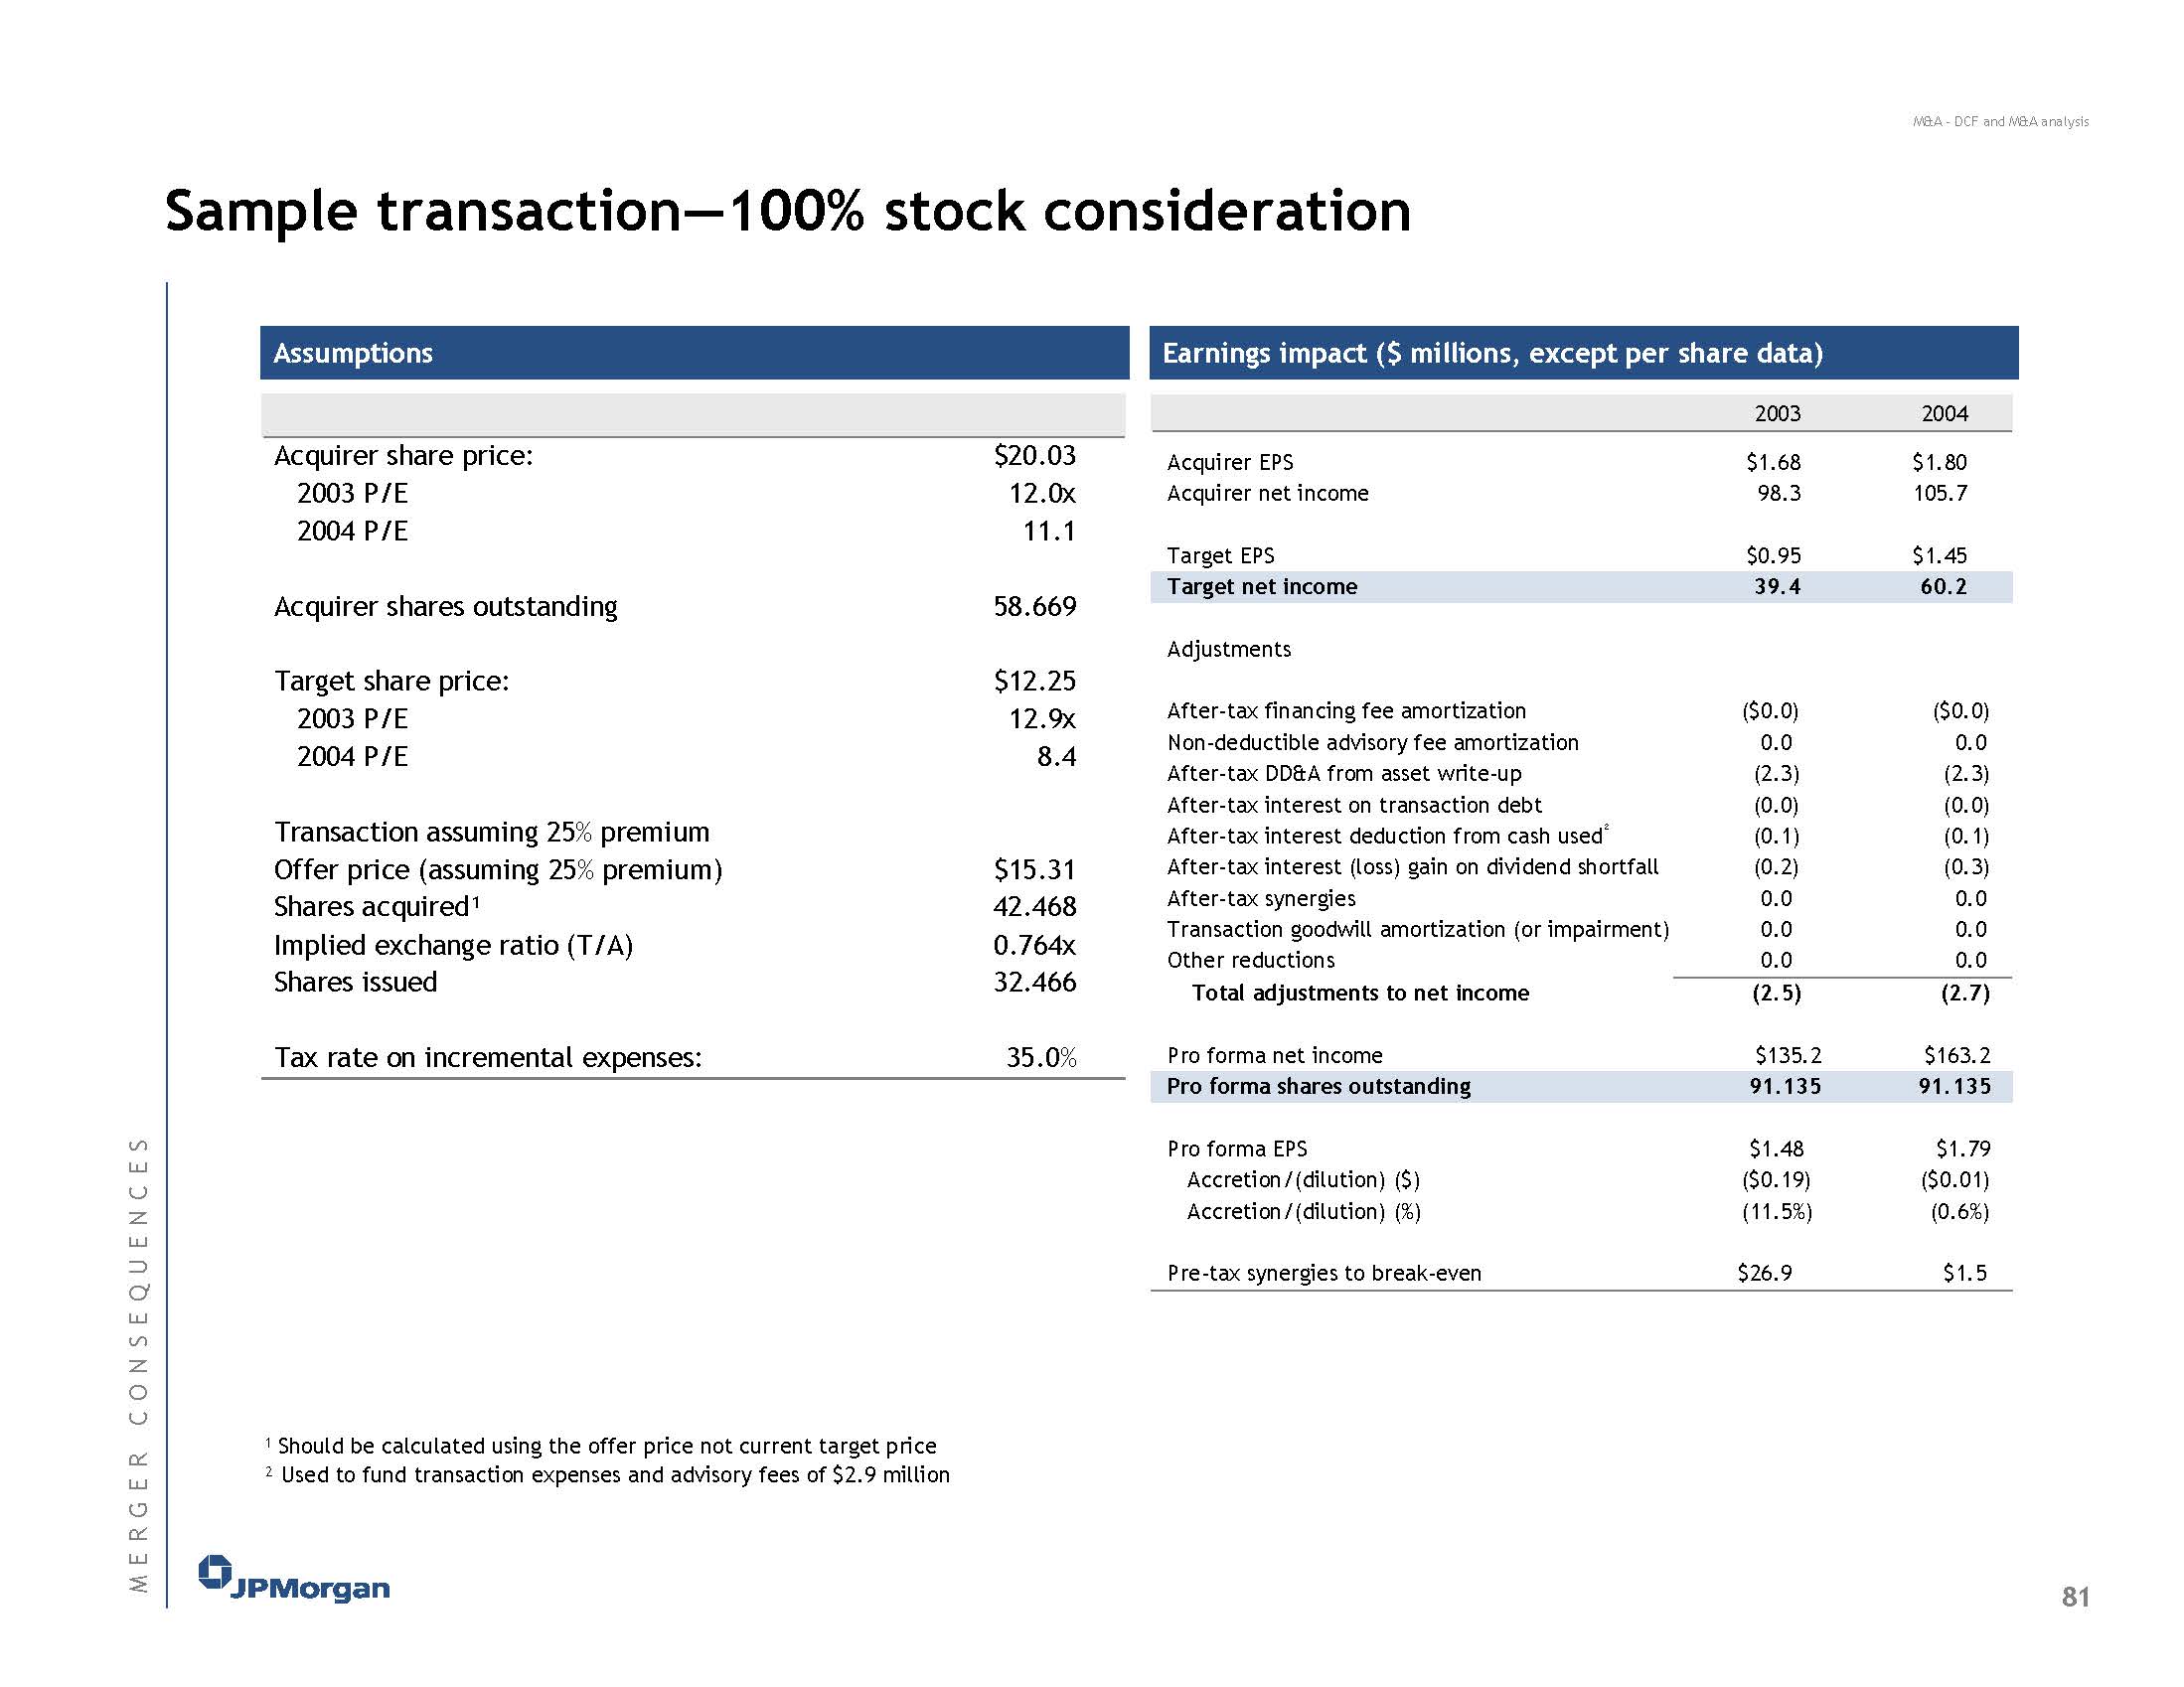
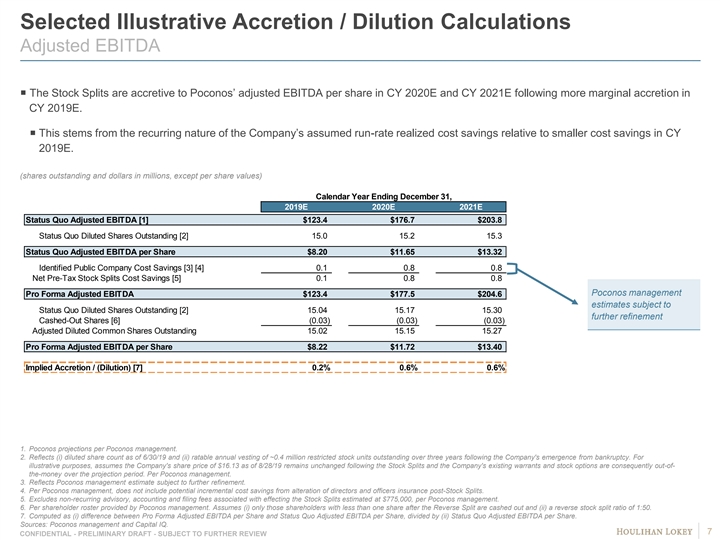
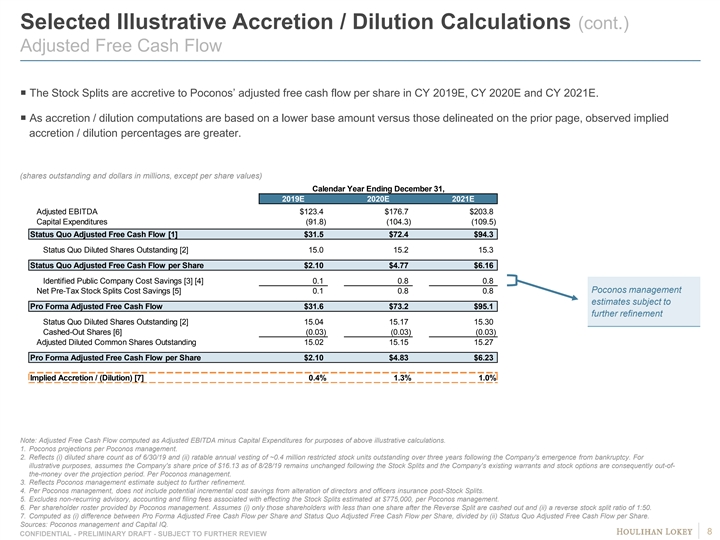
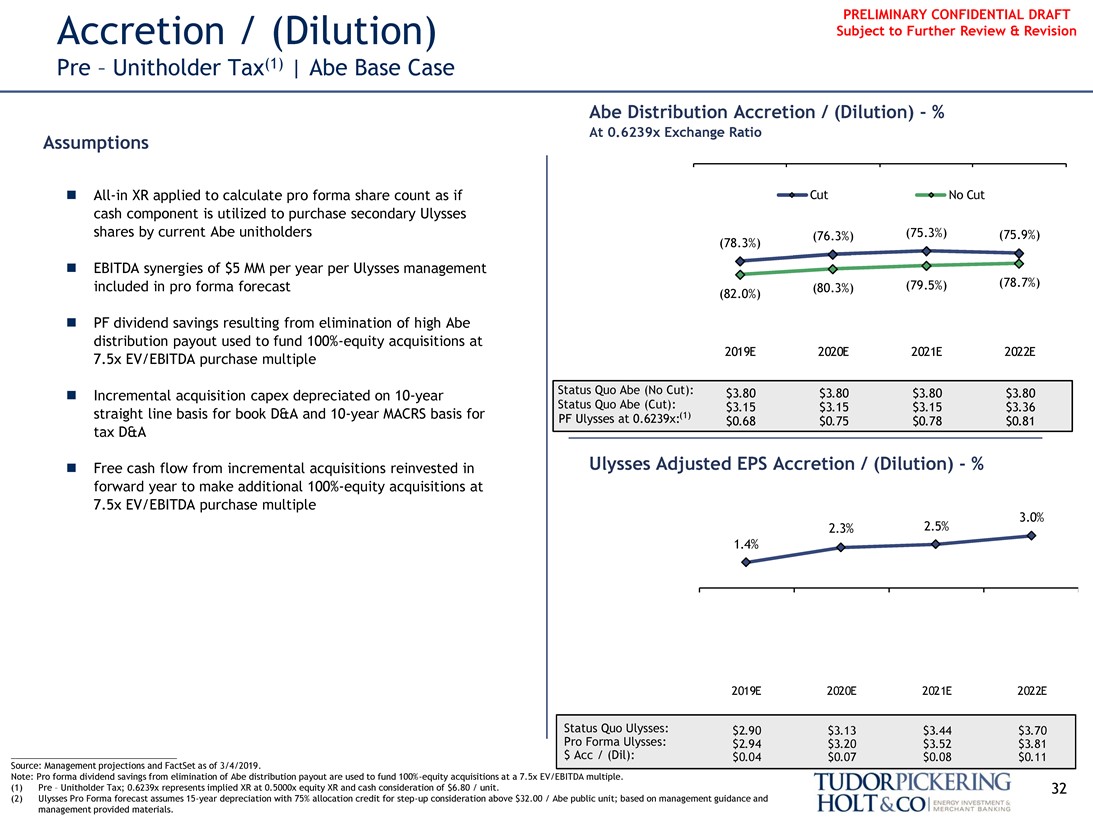
When you stick earnings together, that’s your “Pro-forma” net income which when you divide by the shares, you arrive at pro-forma earnings per share.
An increase in Pro-forma EPS is regarded as an accretion, while a decrease is regarded as a dilution.
Hopefully, I explained that simply so you get it easily in theory? The practice is more complicated as usual.
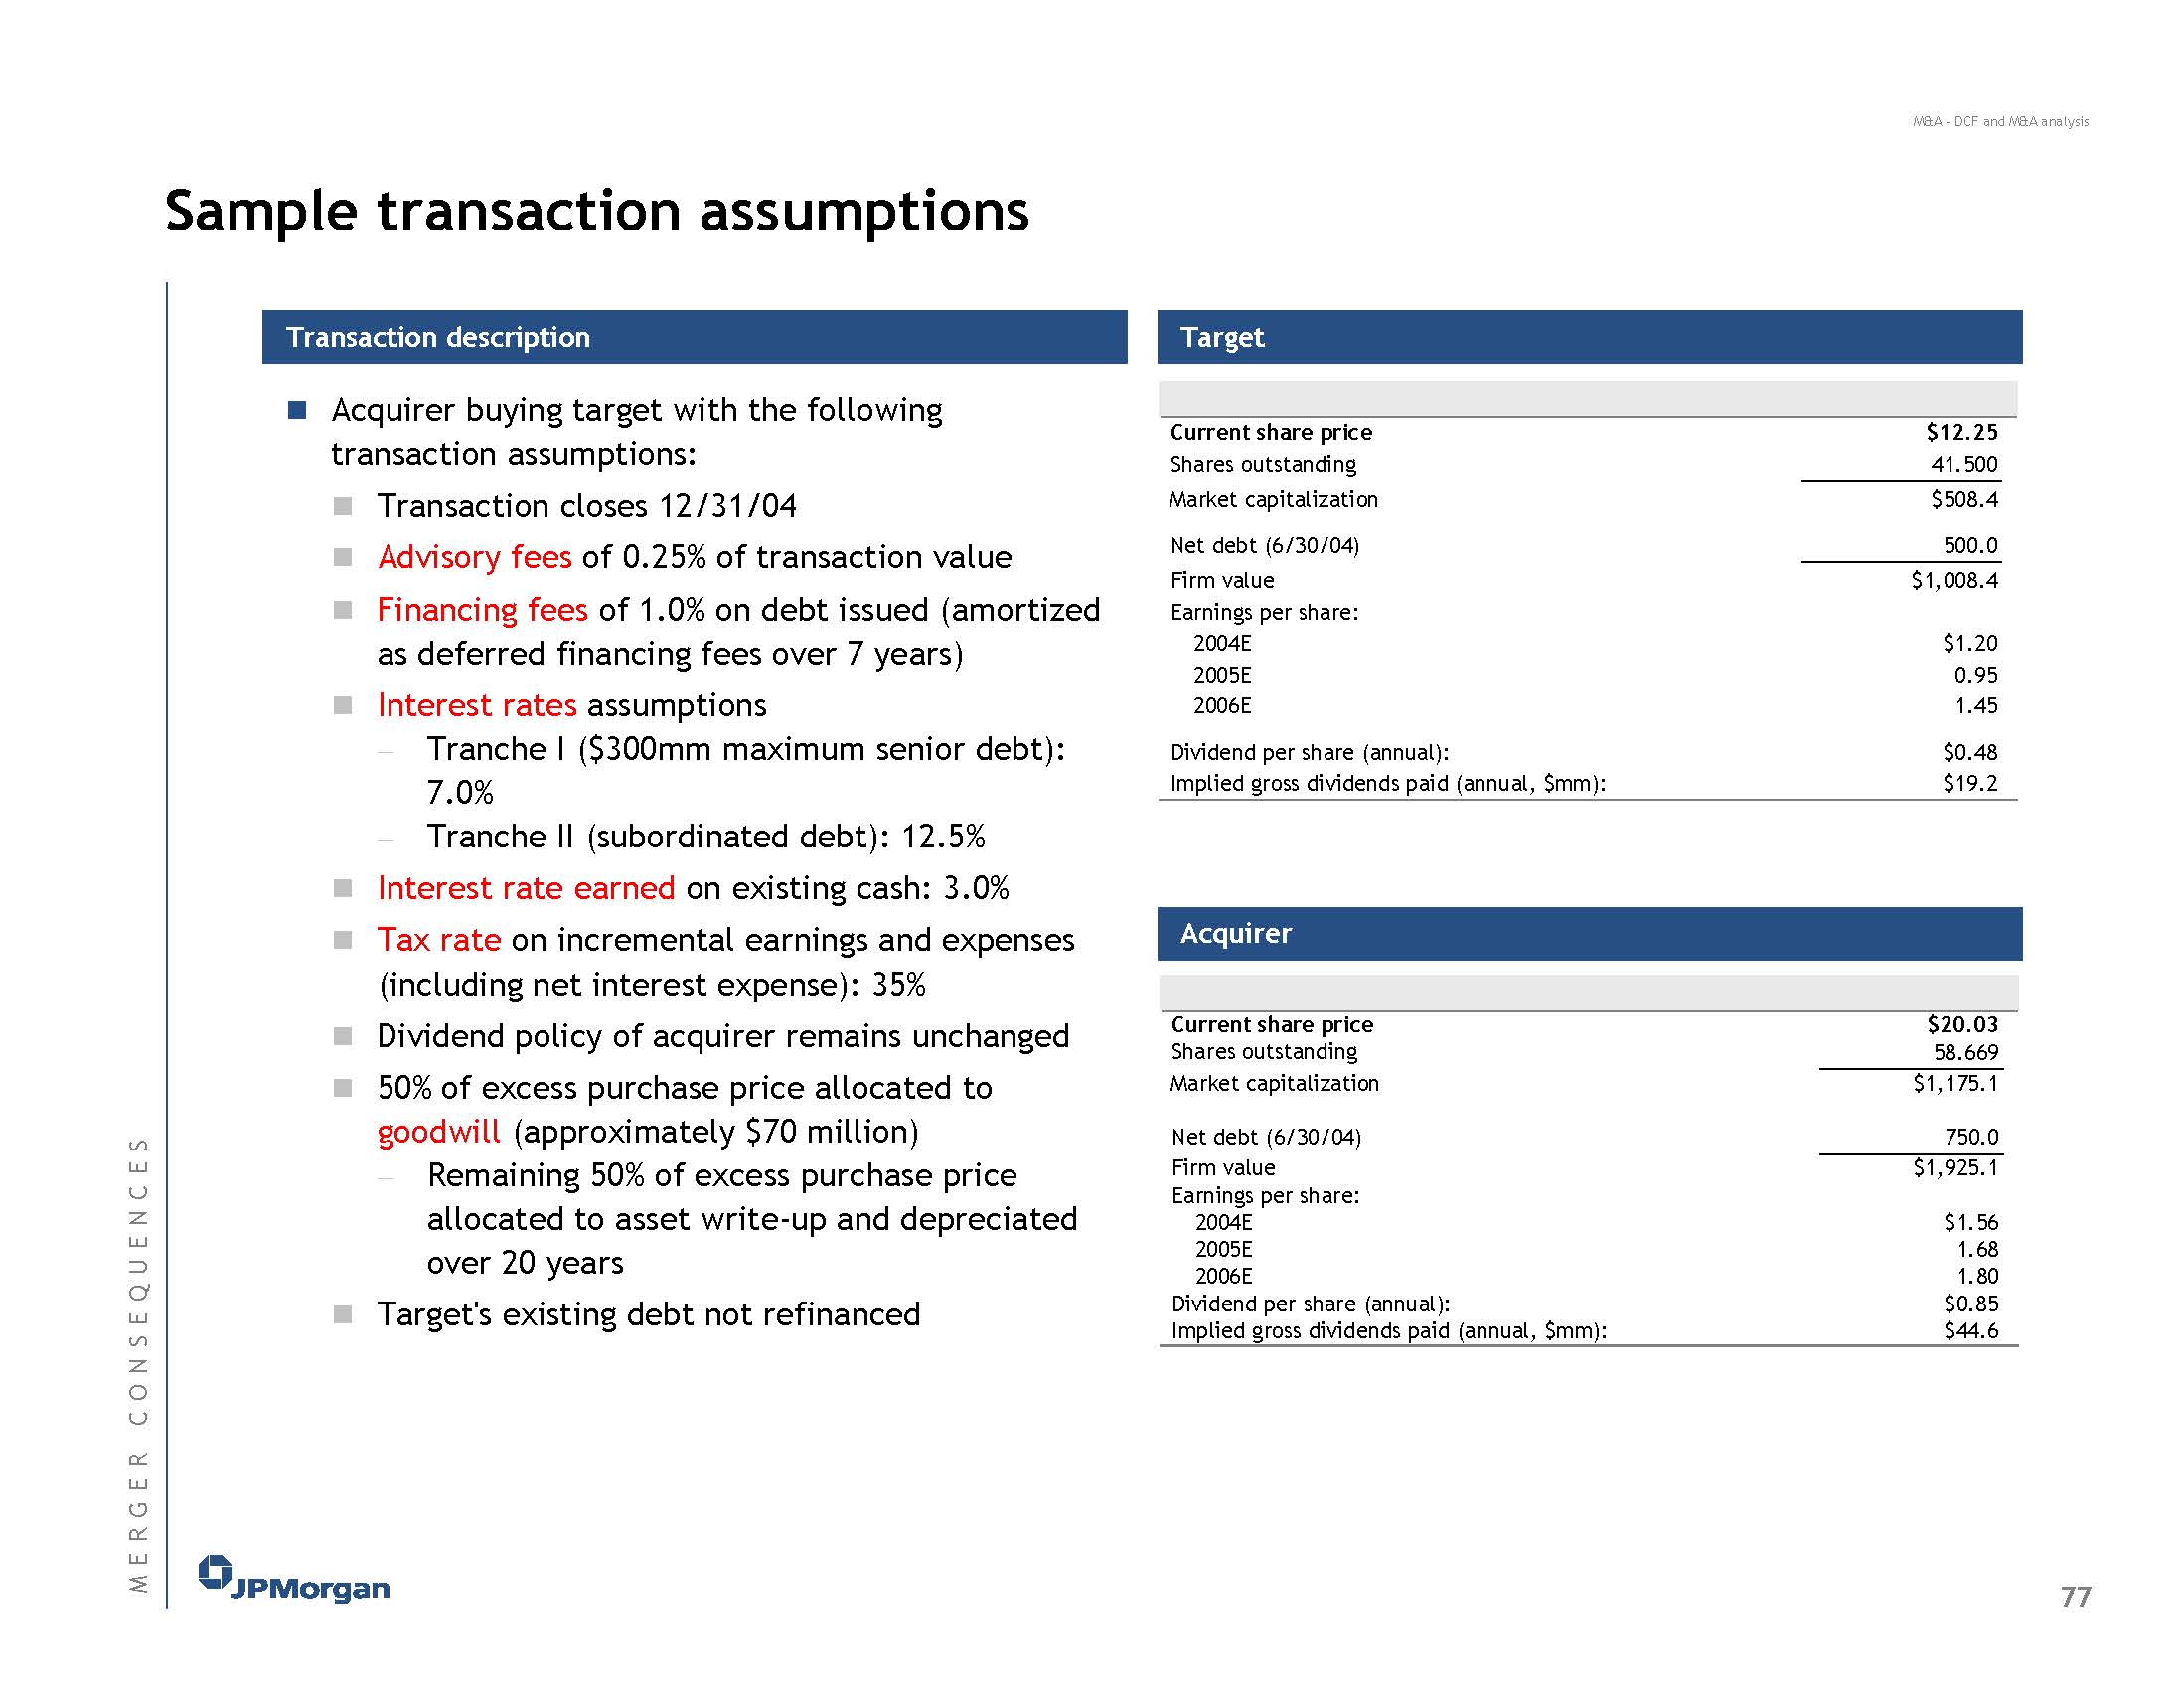
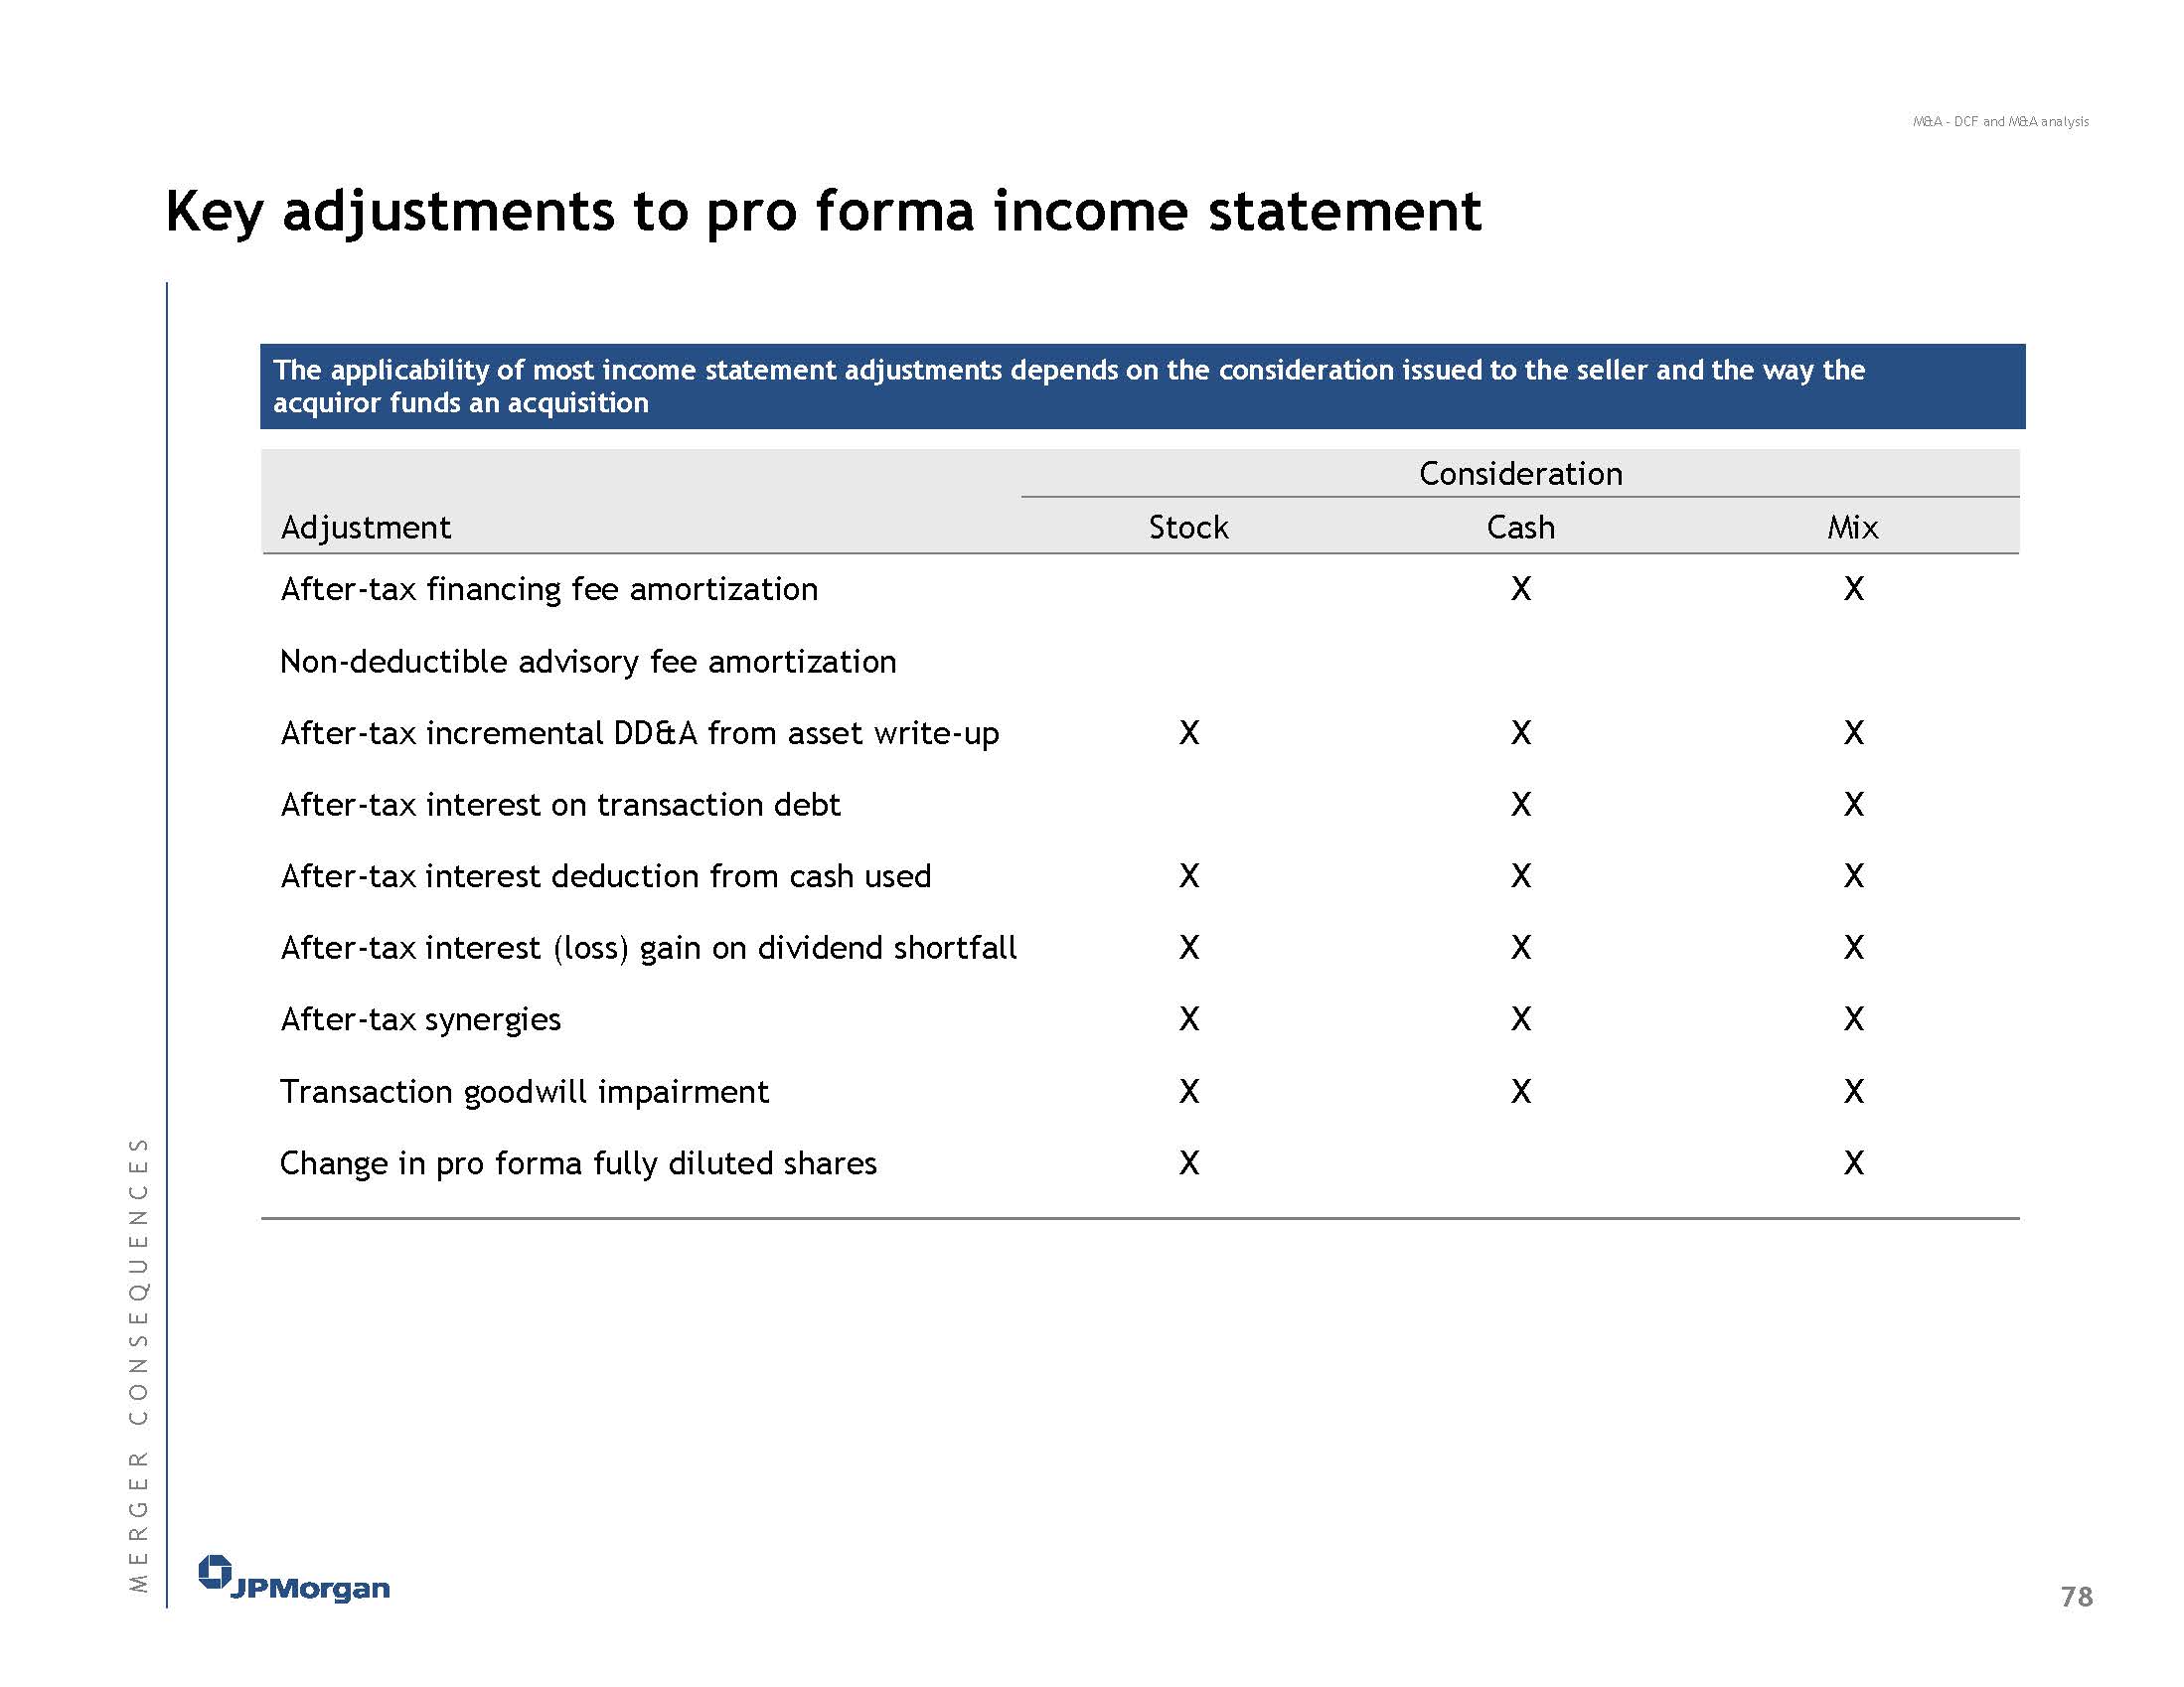
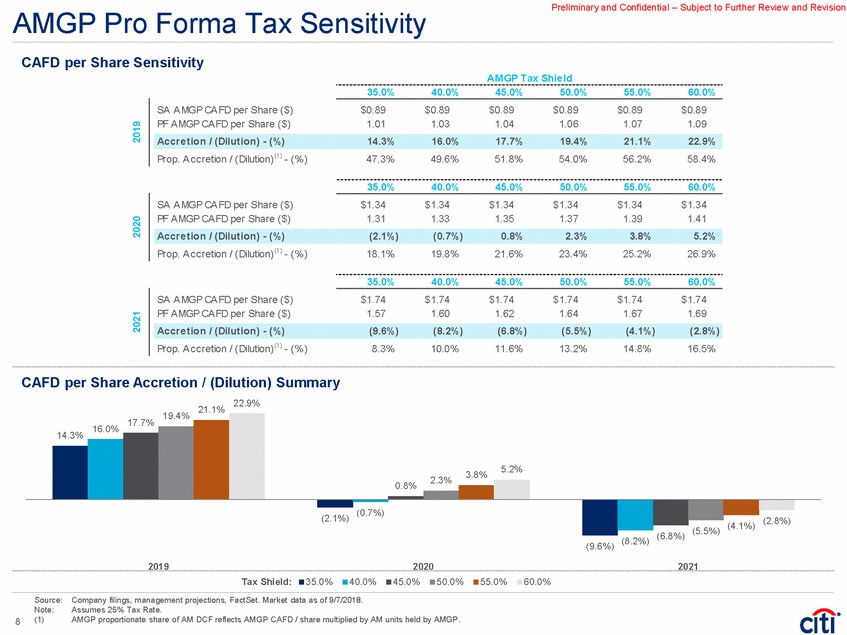
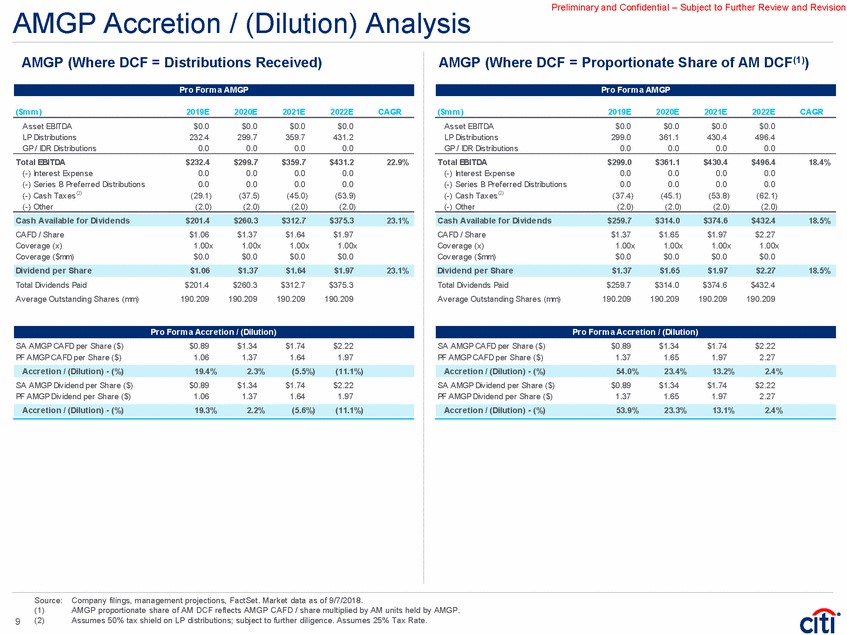
There are all sorts of adjustments you will have to make for the math to work.
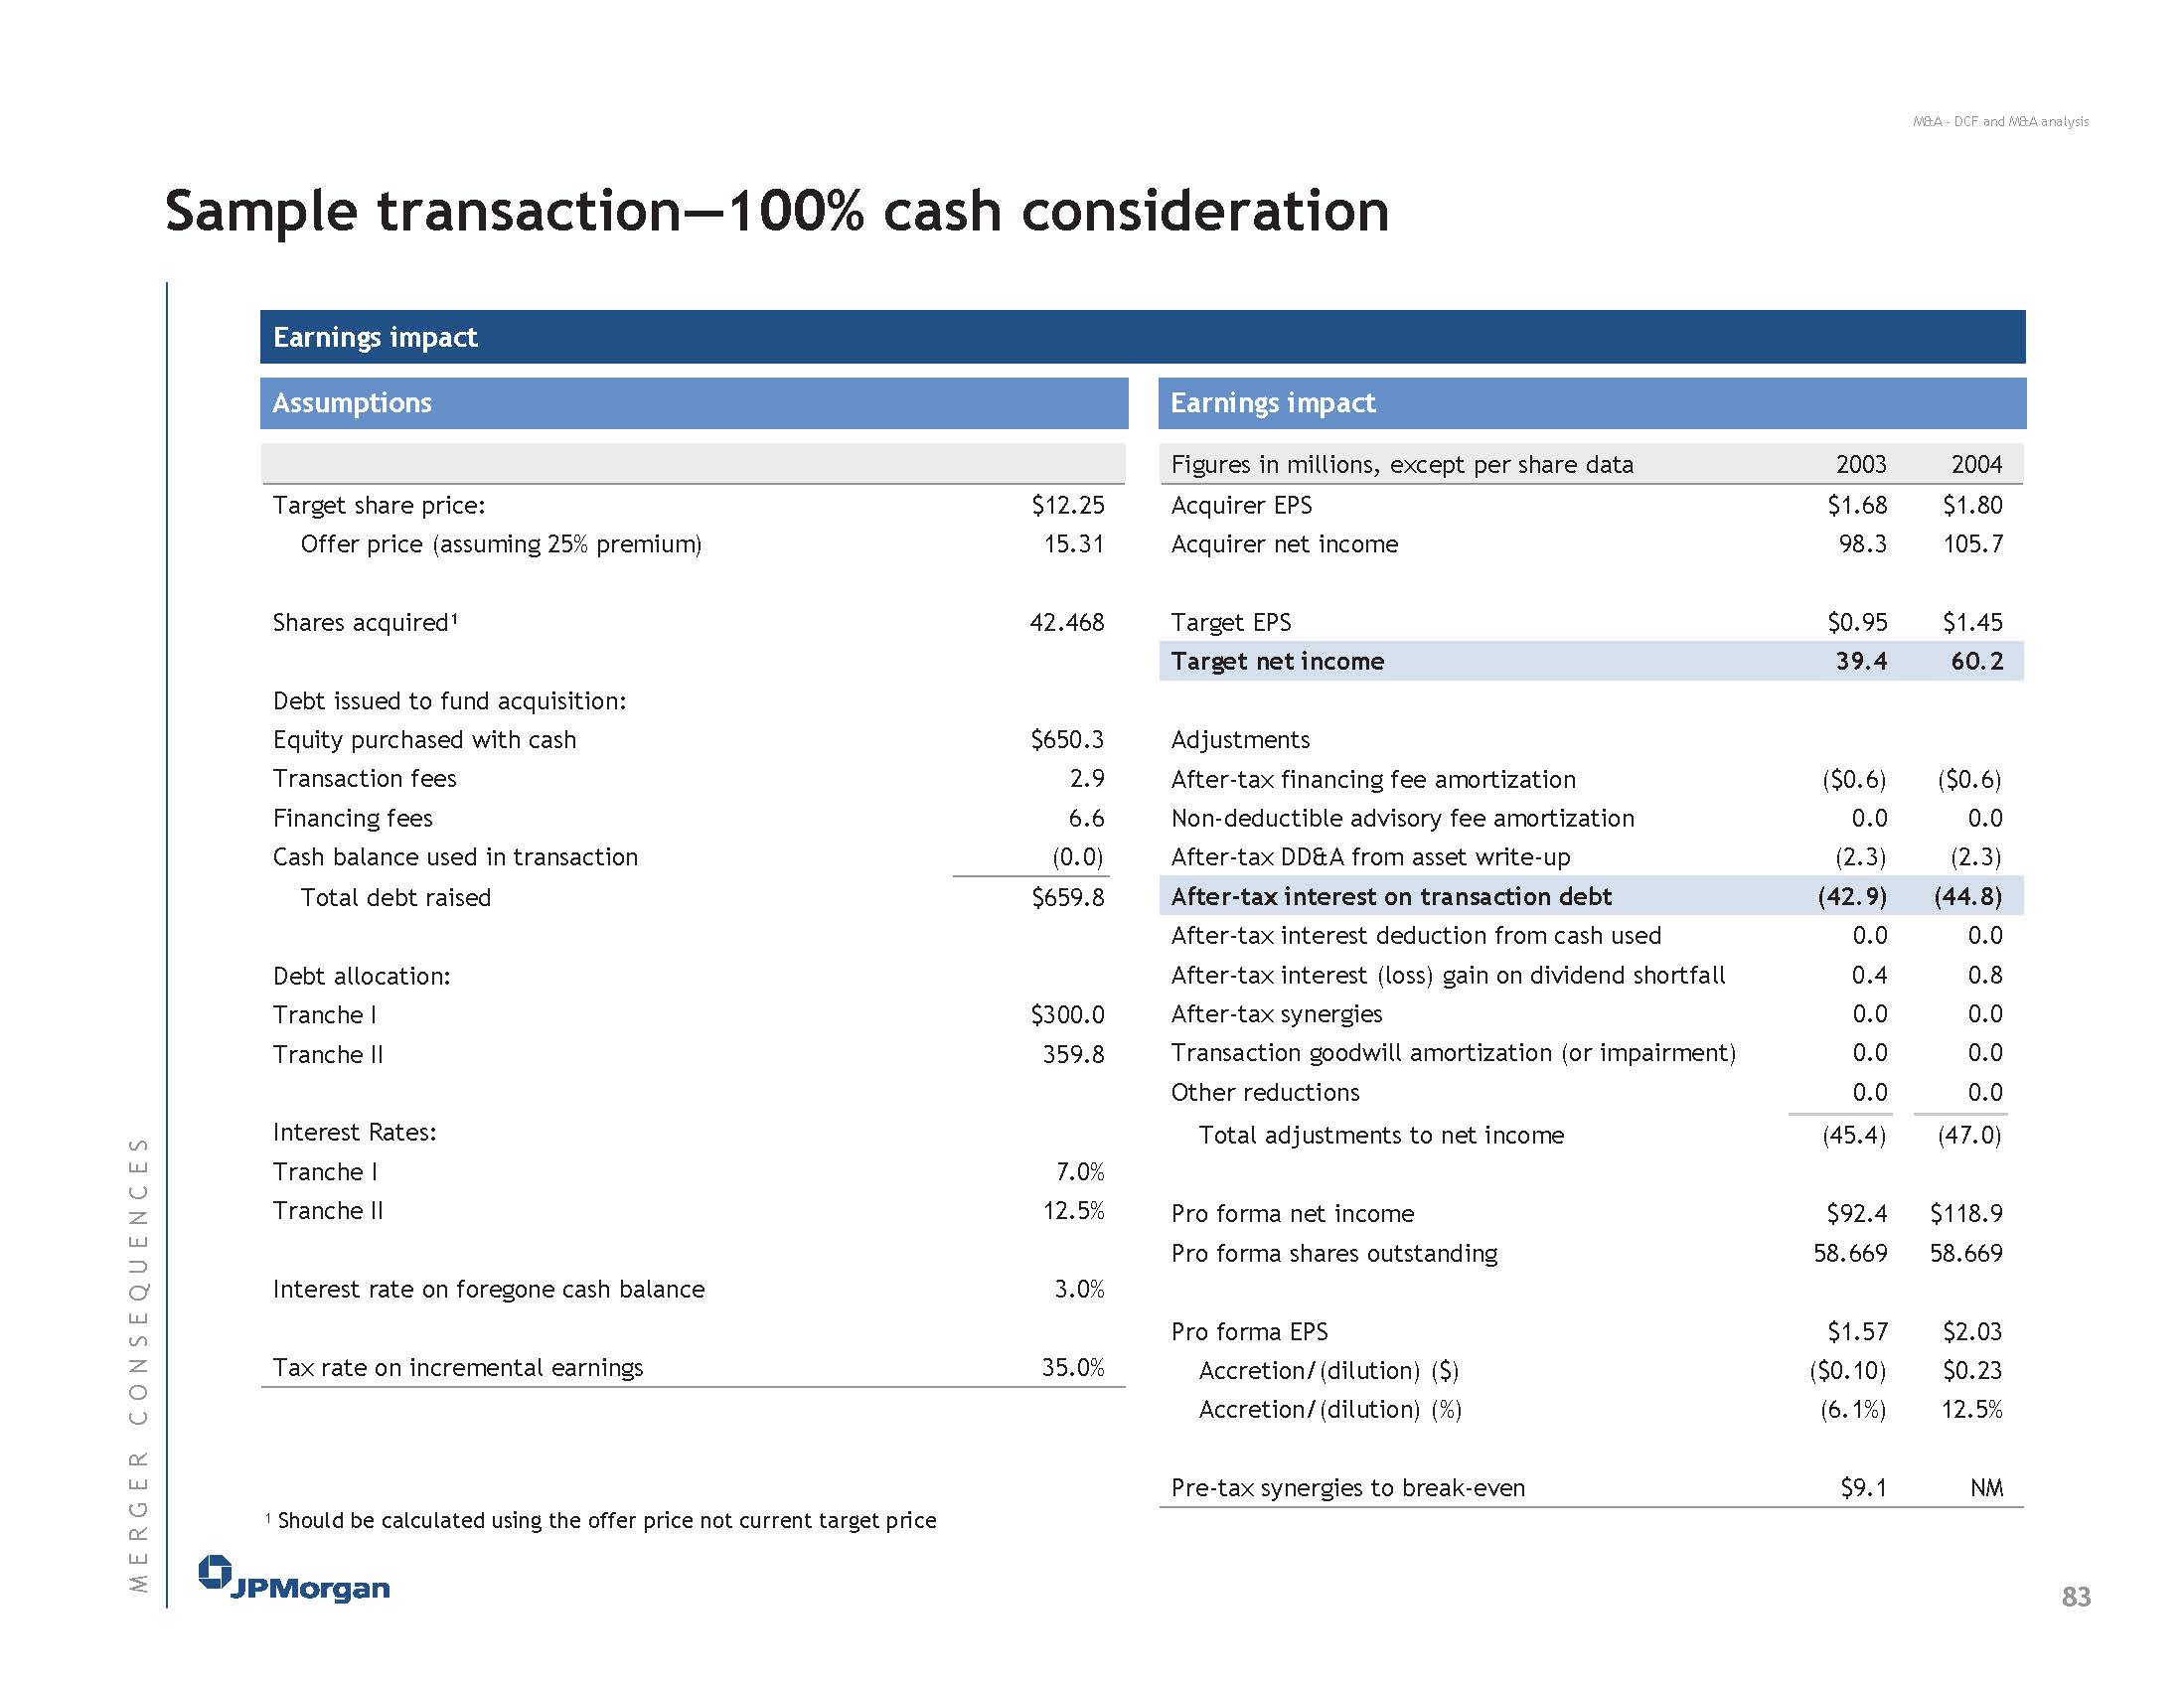
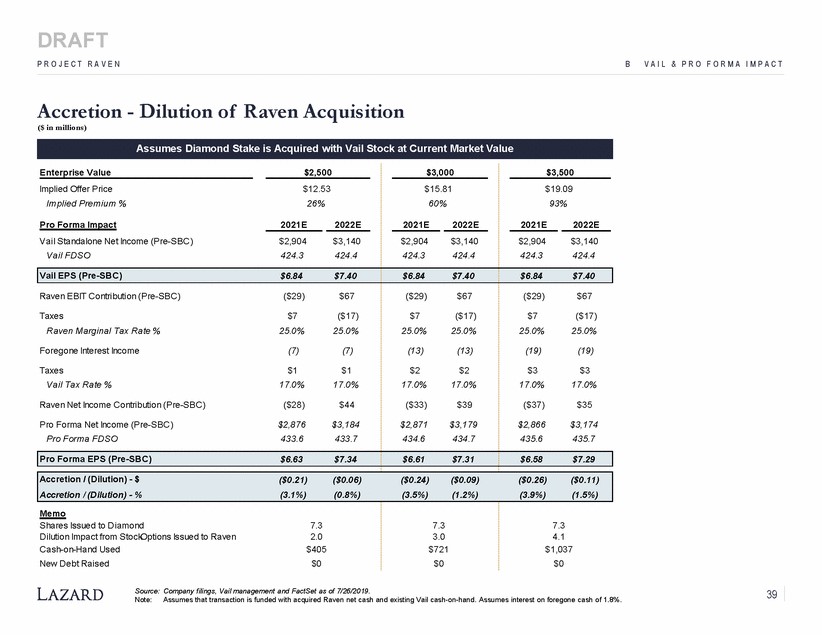
For example, let’s just look at the “Interest (Income) / Expense”. This line item can be broken down into four components:
- The sum of the standalone companies’ interest (income)/expenses,
- Incremental interest expense on acquisition debt, if any, used to finance the transaction,
- Any interest income lost due to the use of the companies’ cash balances to fund the acquisition, and
- A reduction in interest expense due to conversion, if any, of TargetCo’s convertible securities (TargetCo’s convertible debt pays x% interest if not converted, but pays no interest if converted to equity).
- You could also make adjustments here for TargetCo’s standalone contribution to the combined company’s interest expense based on whether the previously outstanding debt was retired or assumed by the buyer. For example, if the buyer retires the target $xm convertible debt issue, there would be no post-transaction interest expense associated with the convertible debt regardless of whether or not the convert is “in-the-money”.
So yeah, the devil is in the details.
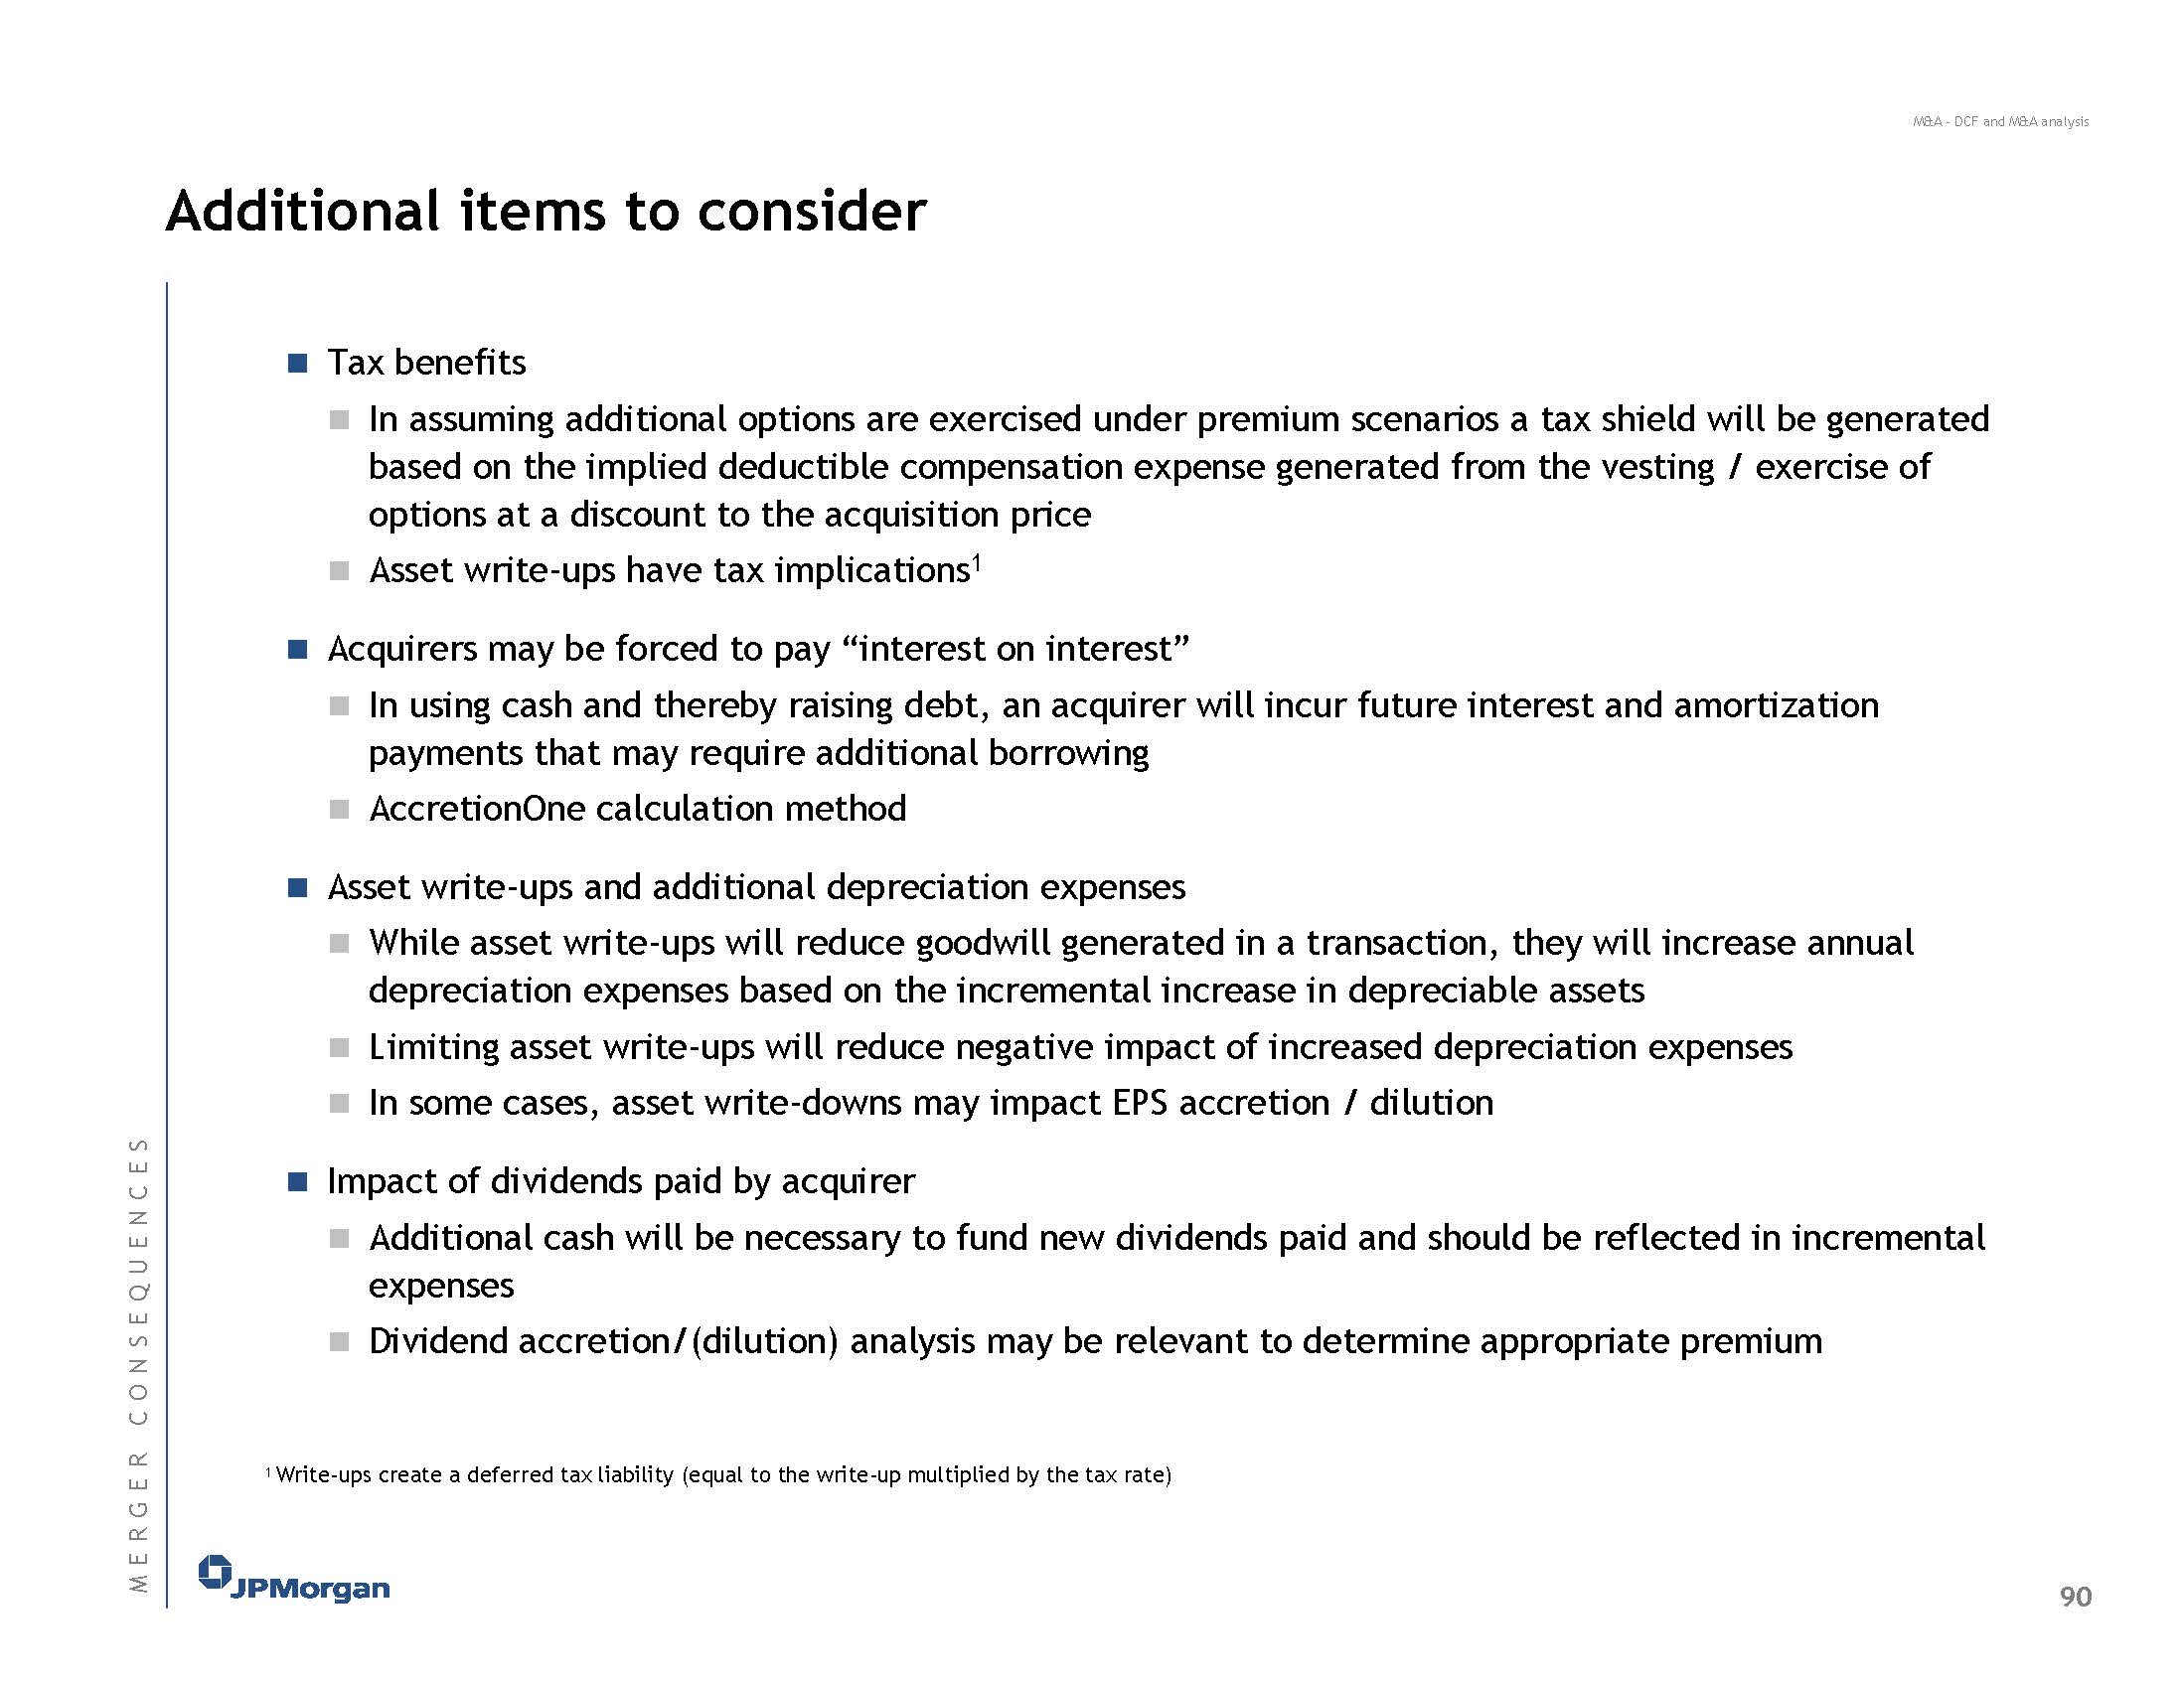
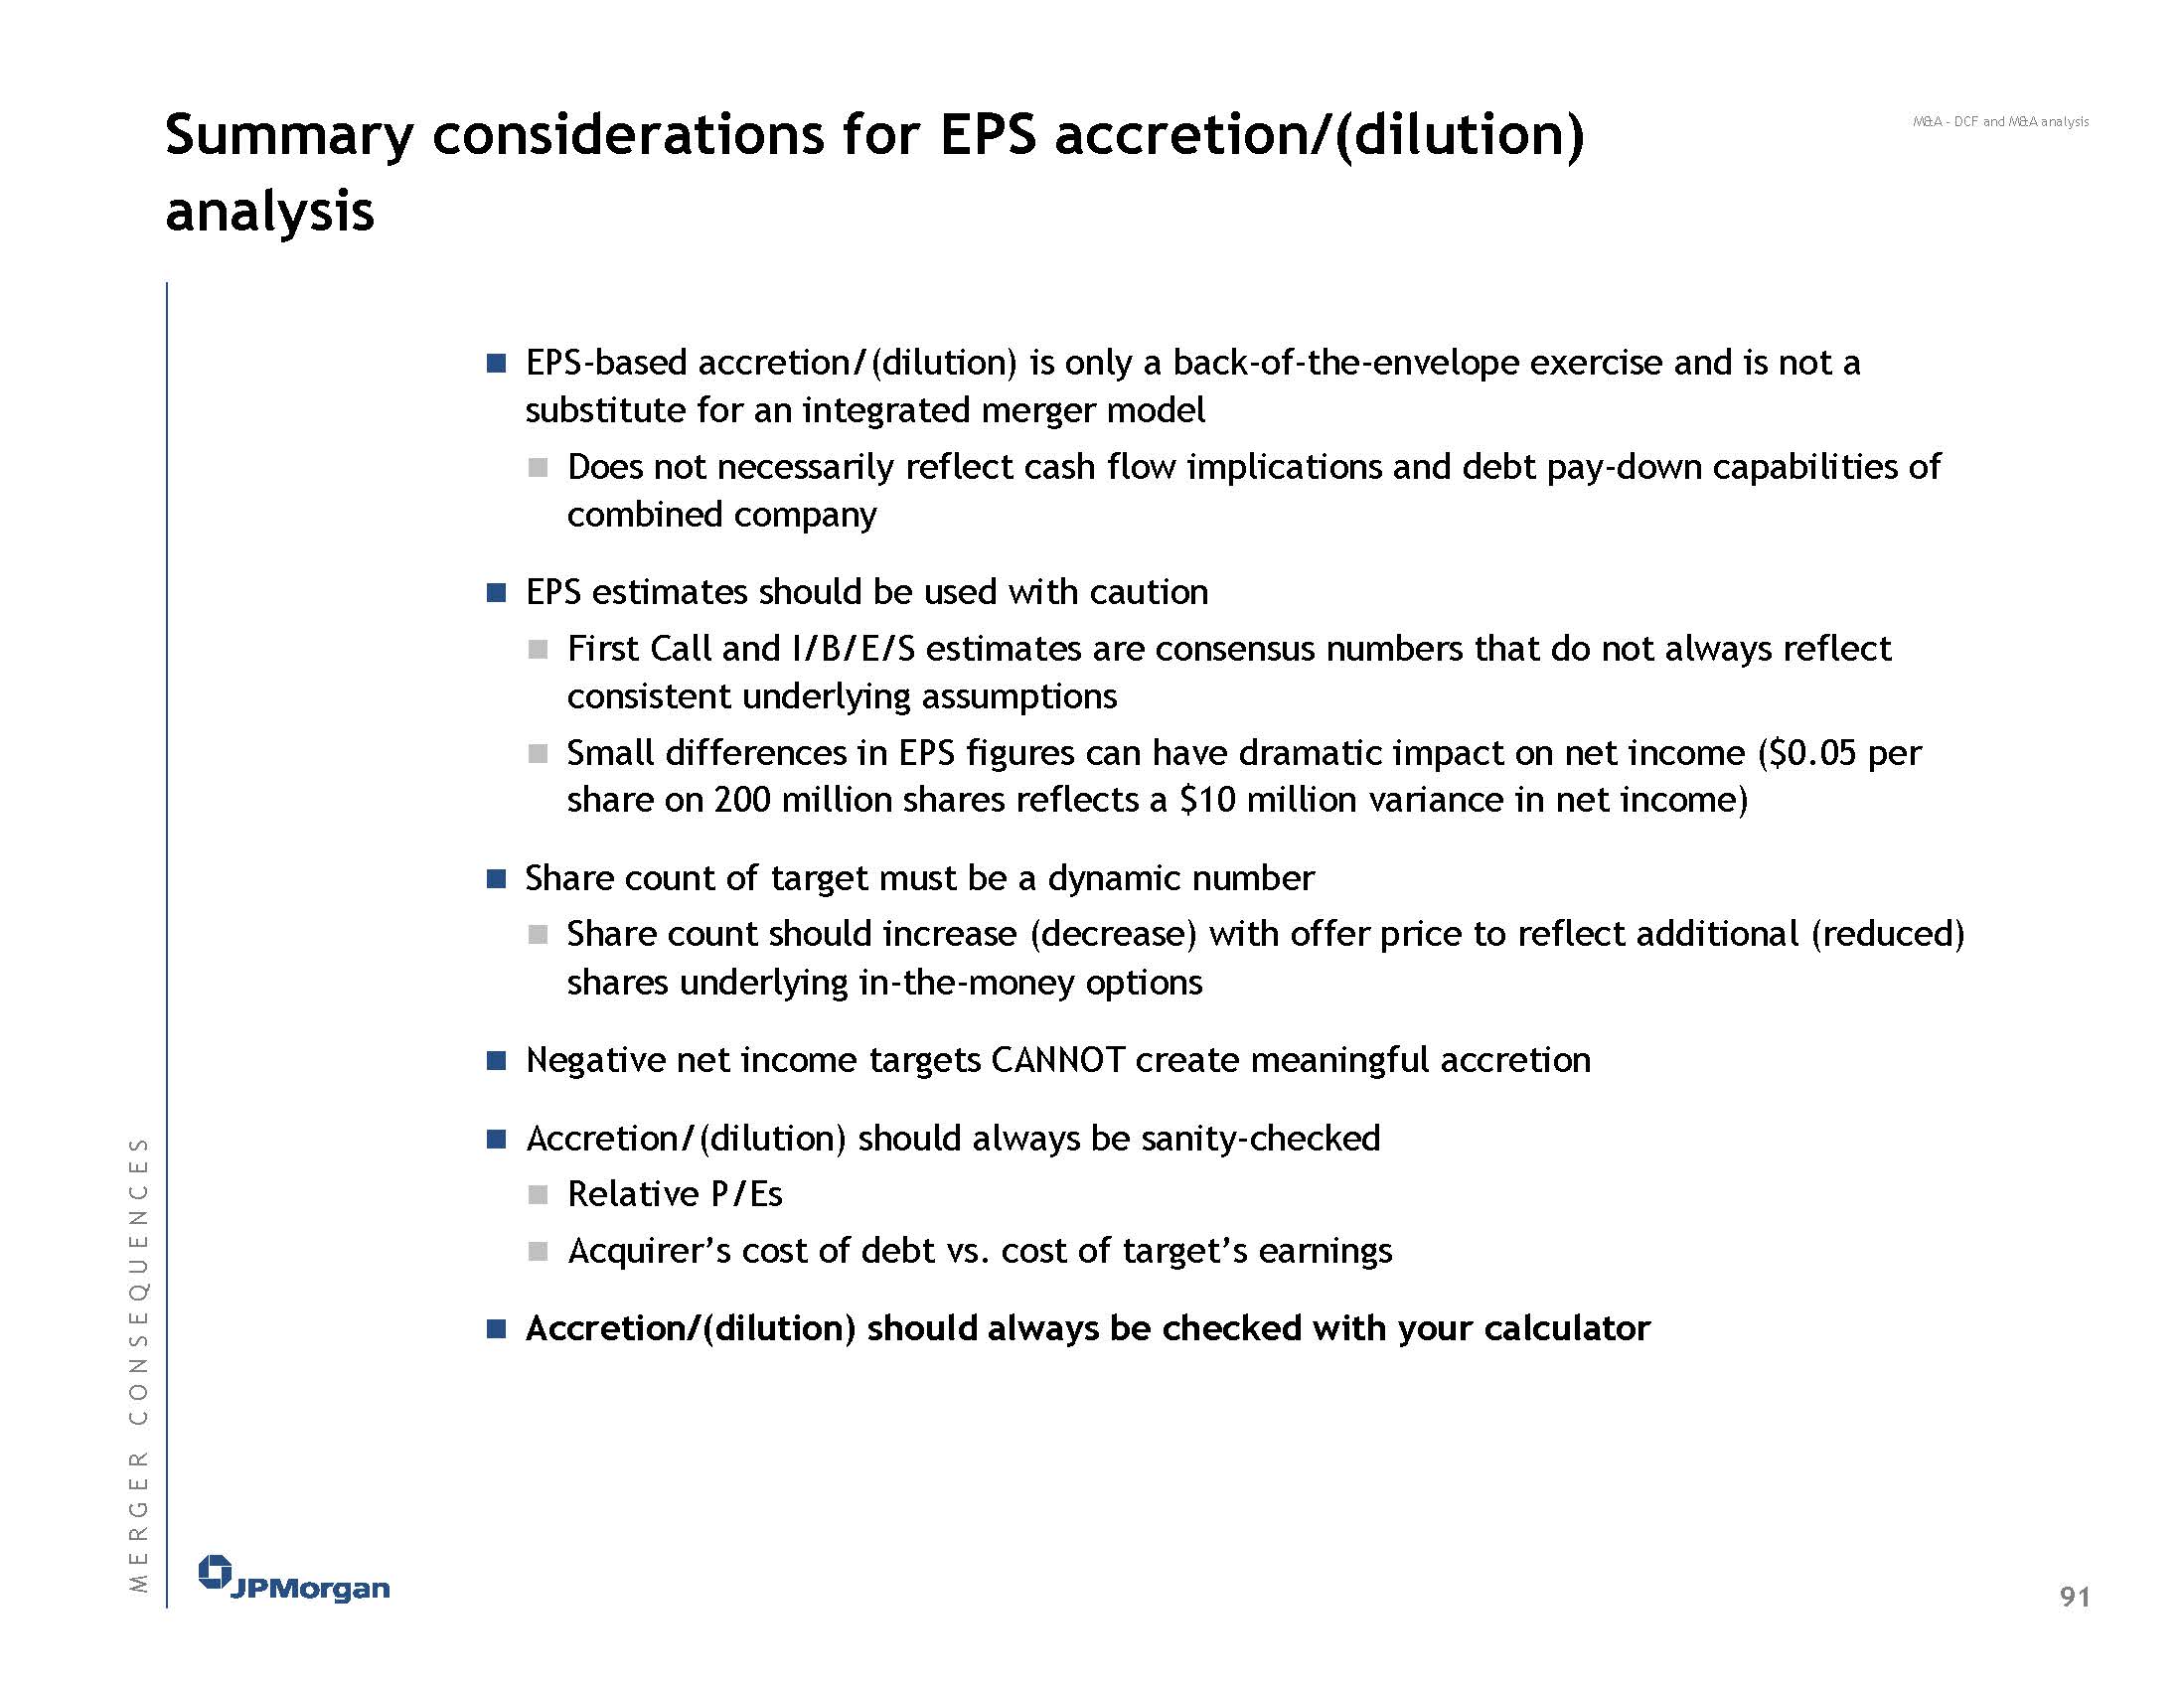
Here’s a guide from JP Morgan I found.

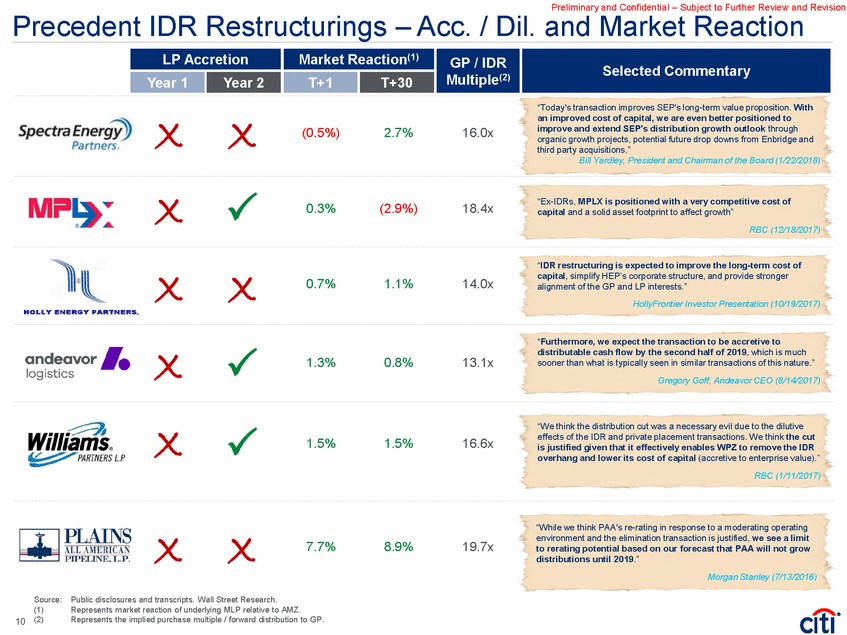
Why these slides are made
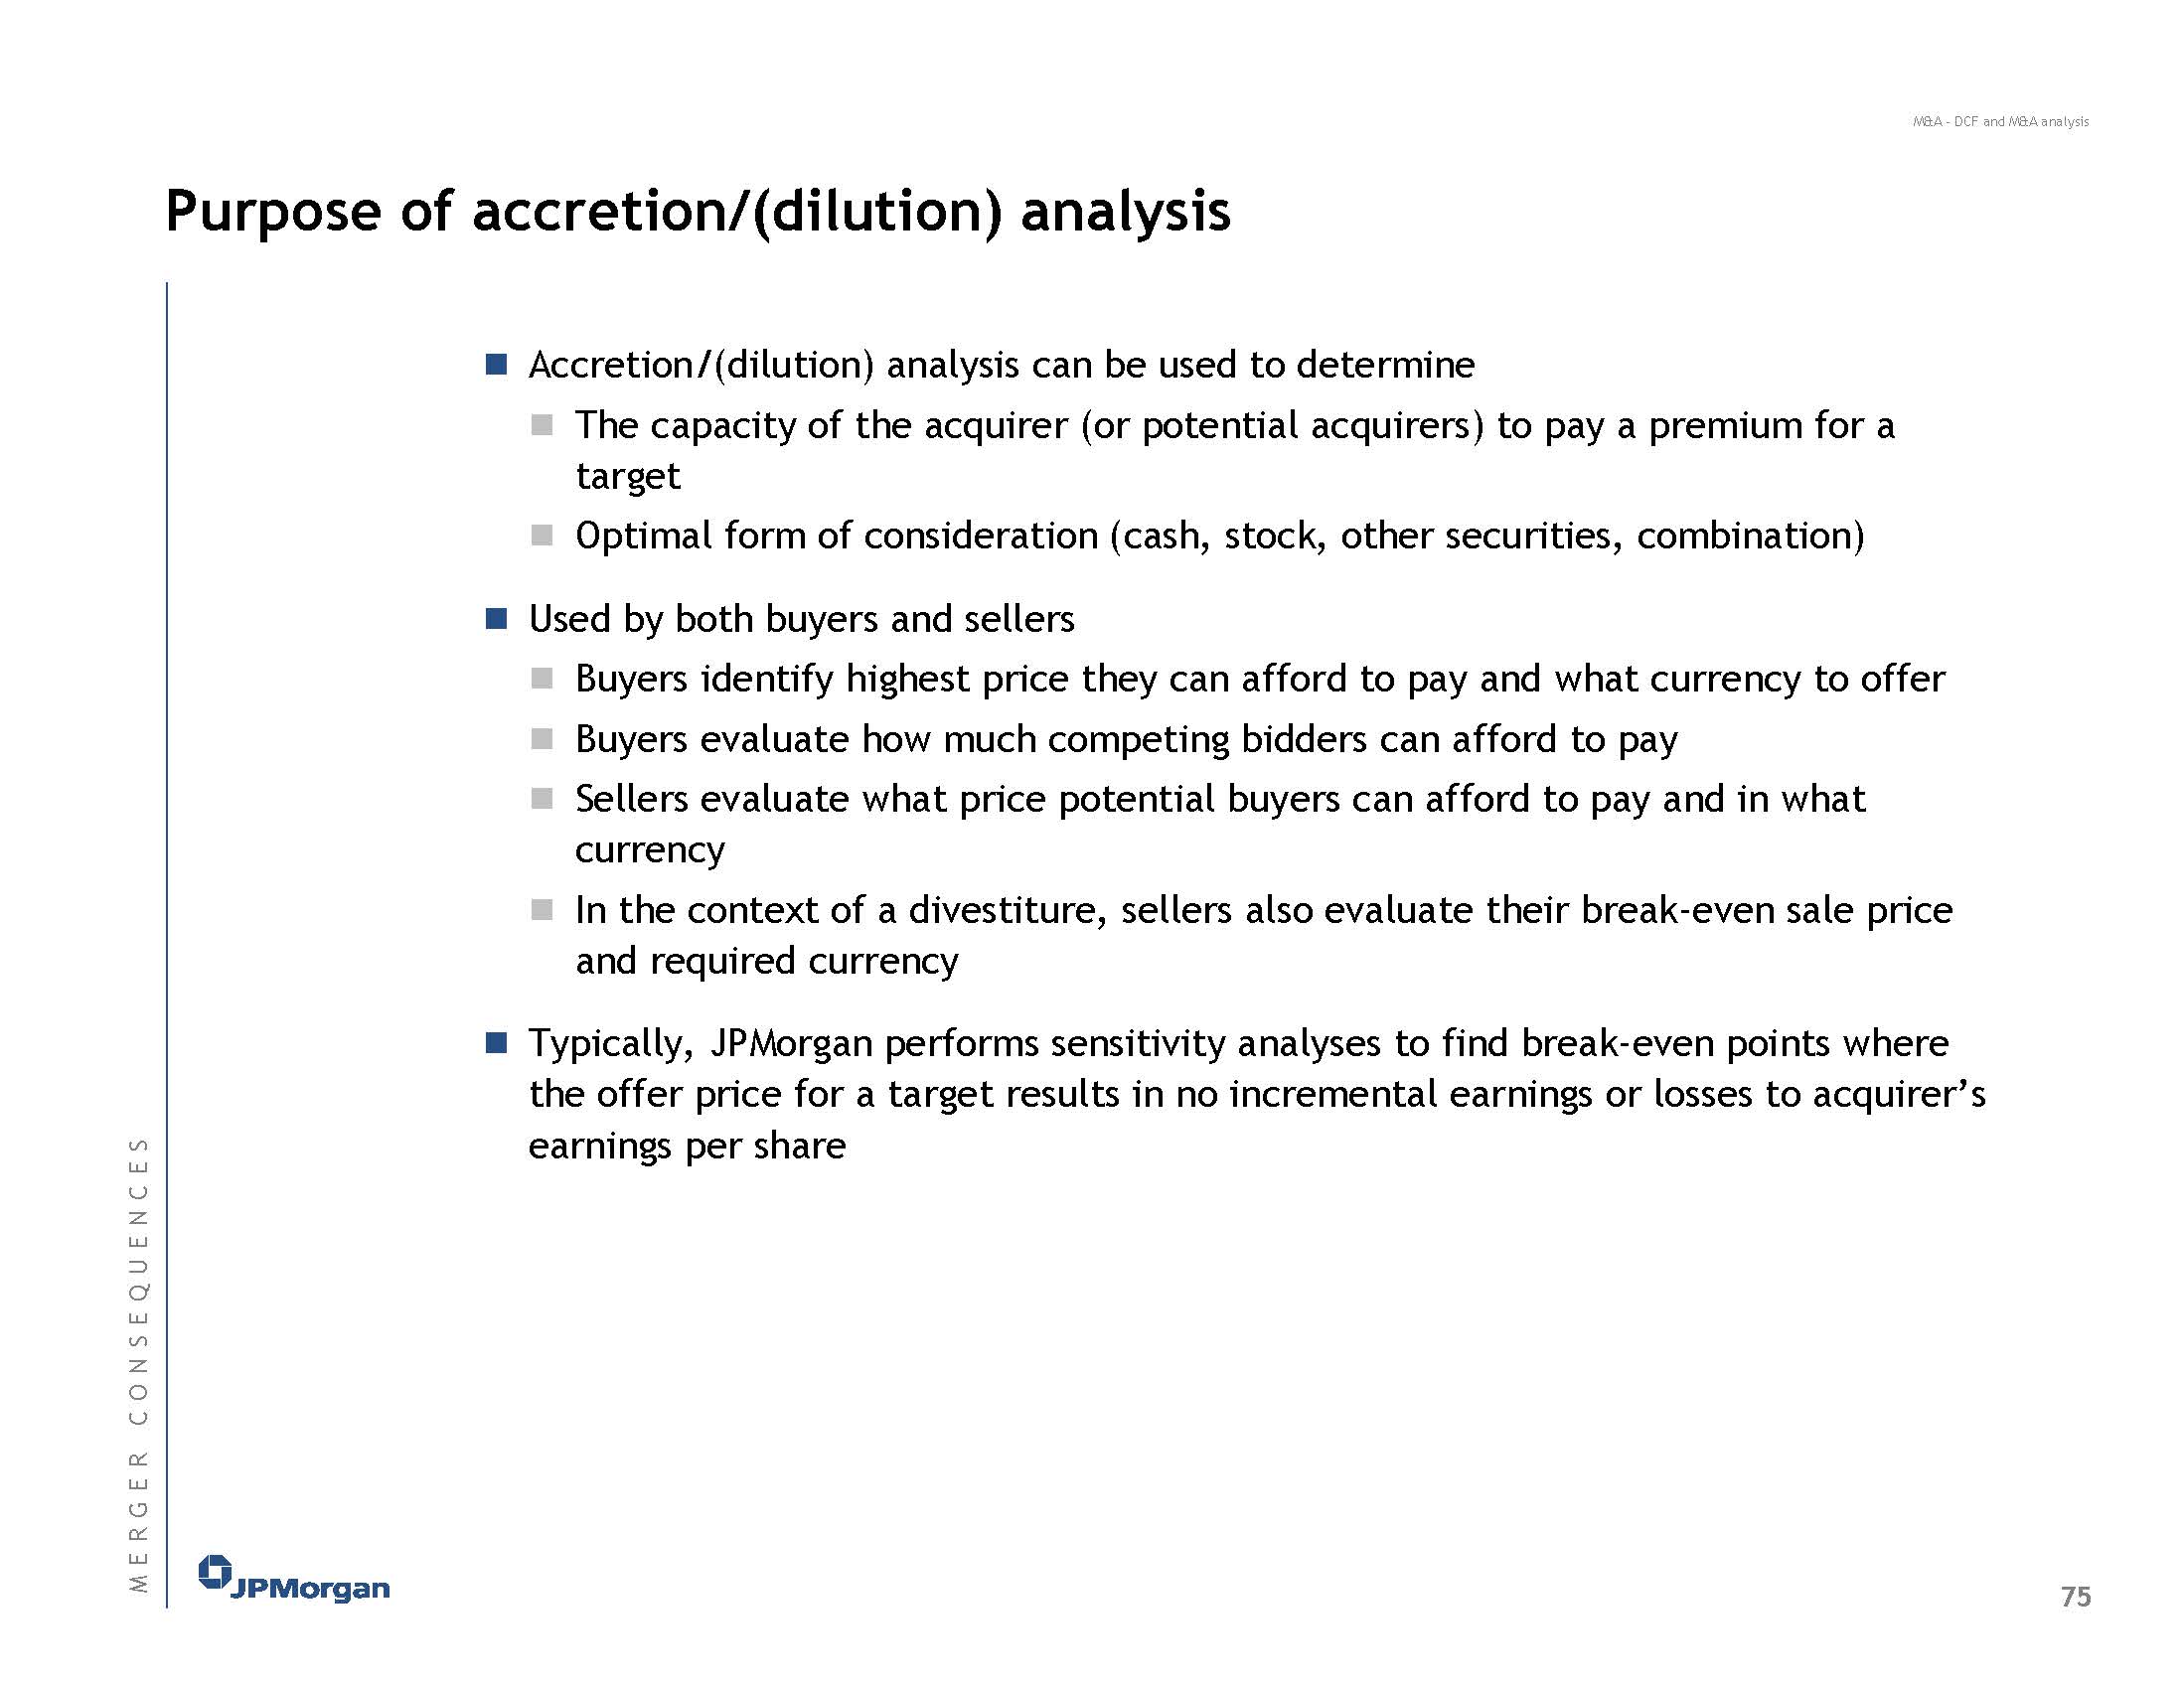
It’s grunt work to do, but it answers a fairly obvious question – does this deal suck, or is it great? If you were the CEO, wouldn’t you want to know that too?
You’ll do this analysis in pretty much every deal which involves an acquisition or merger.
Comments on making these slides
This is your bread and butter work. You’ll first make P&Ls (and CFS and BS for non-FIG companies), then add a DCF, then you’ll start doing accretion/dilution analysis based off this stuff.
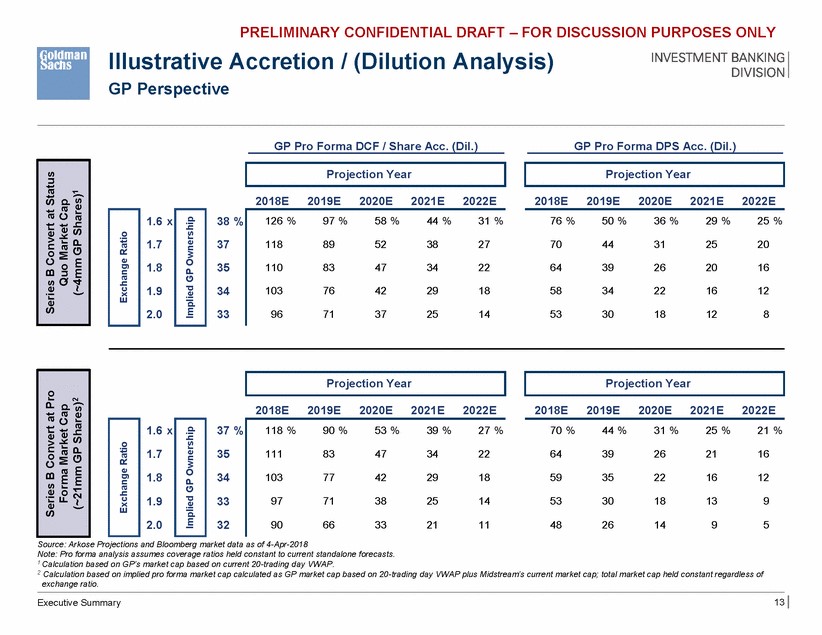
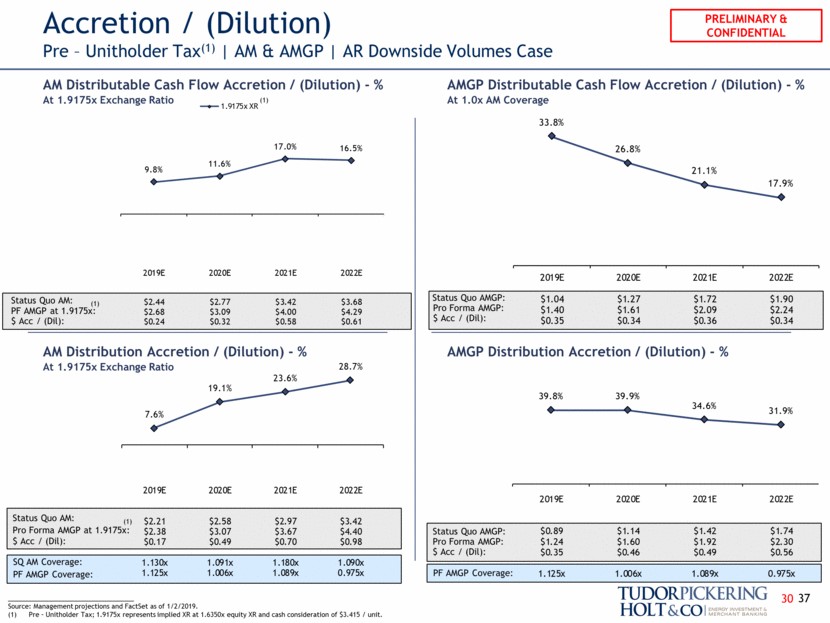
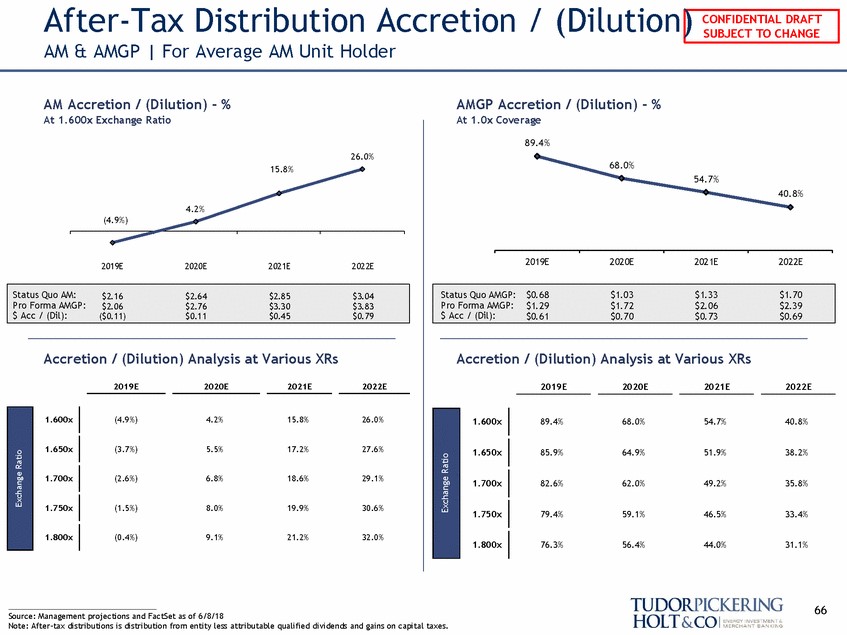
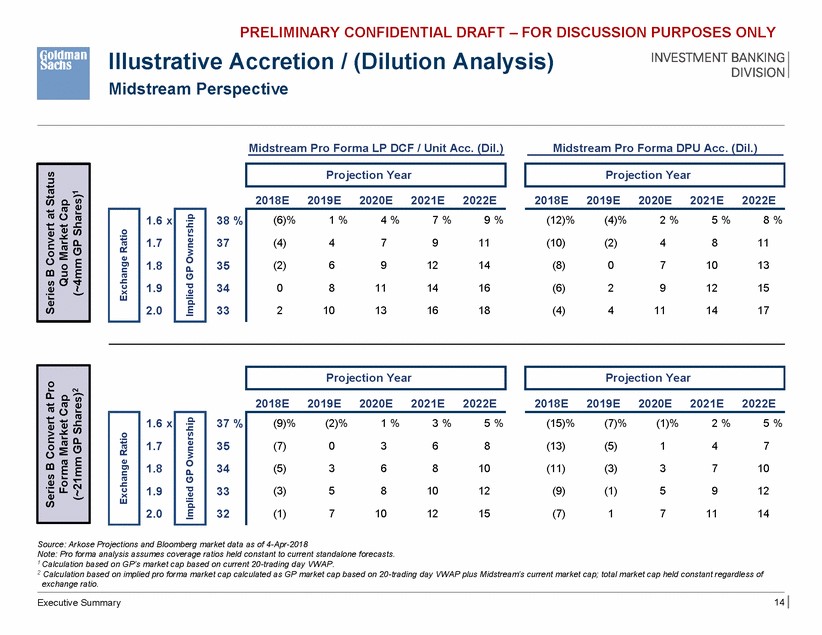
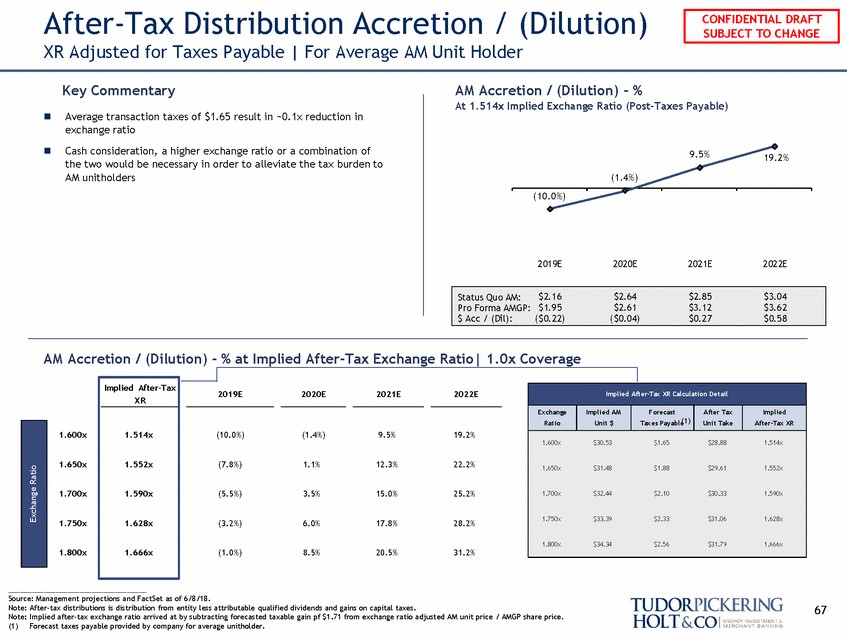
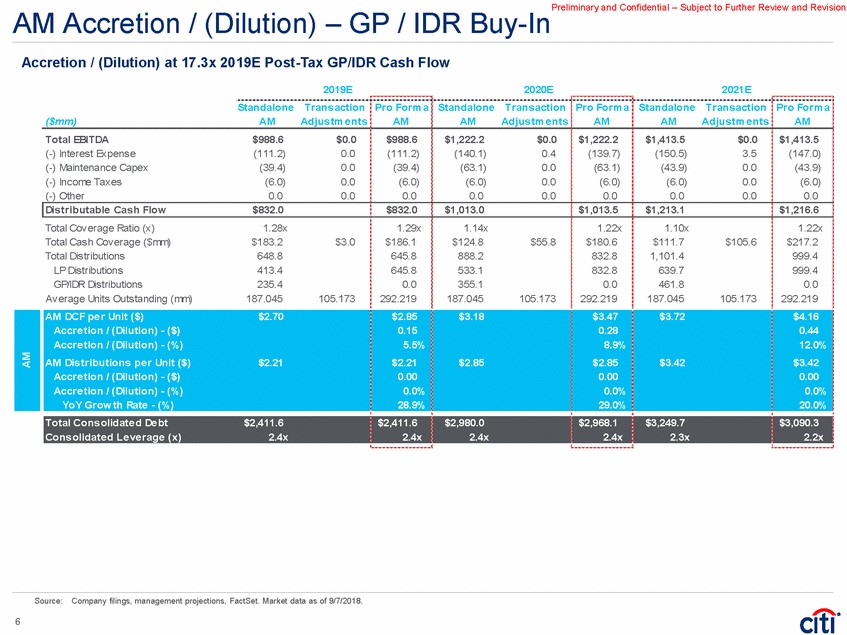
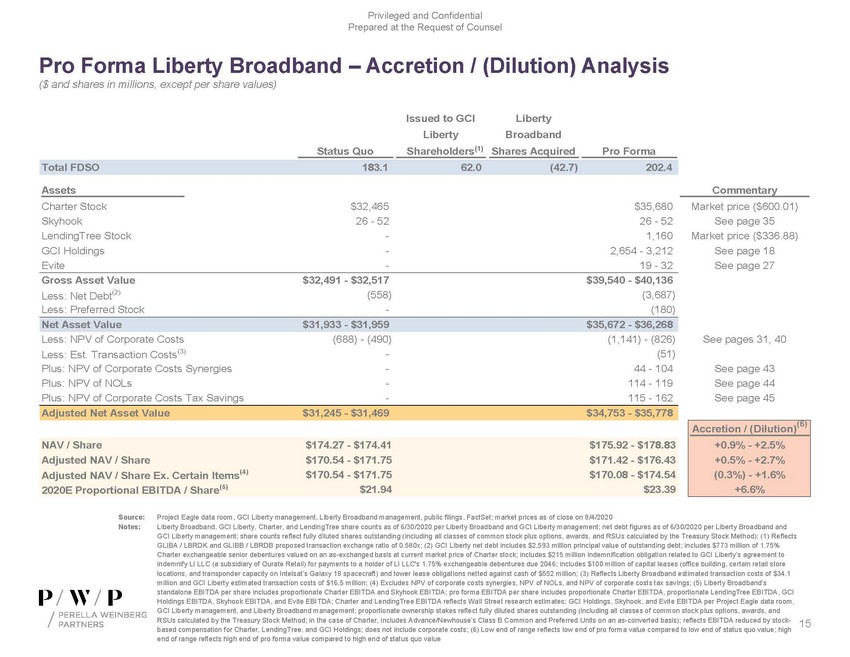
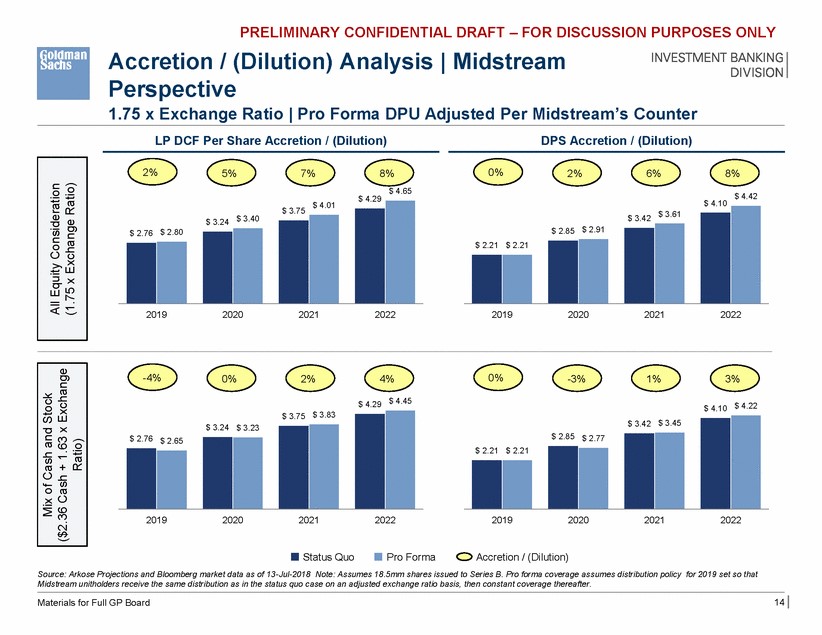
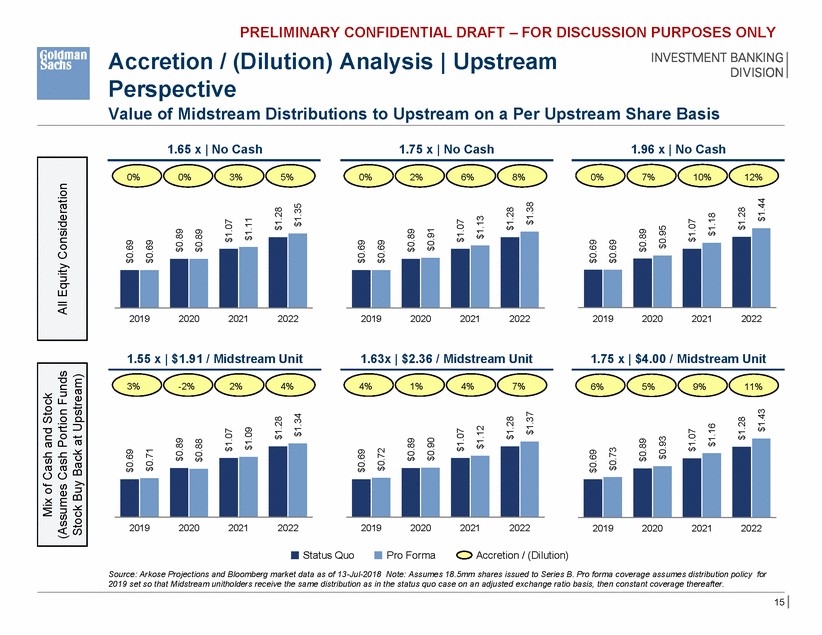
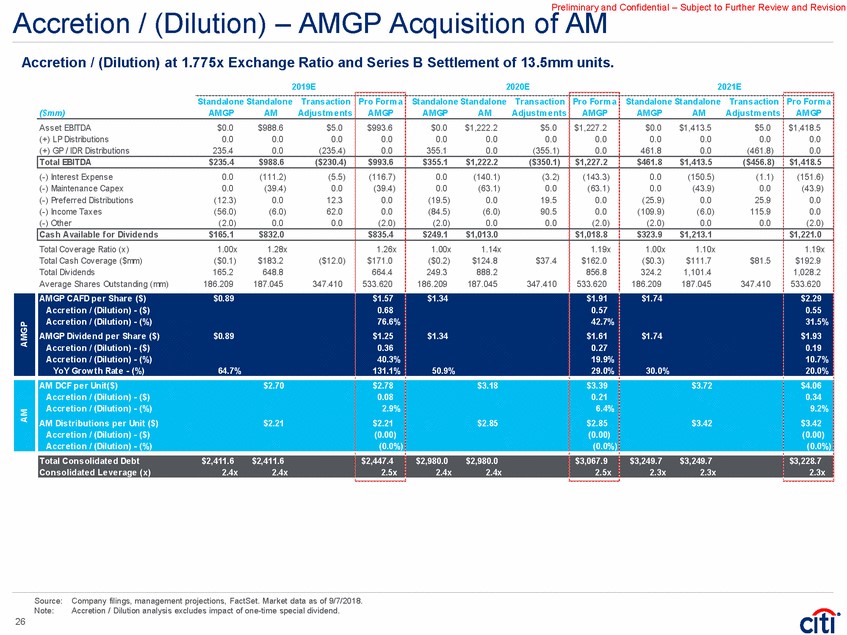
Examples of Accretion Dilution slides


Want to learn more about investment banking presentations?
Want easy access to knowledge?